
The Chart du Jour
A Watershed Day on the Nasdaq 100 &
Longer Term Nikkei Thoughts
We remember quite clearly the late August 1982 advance in the DJIA which marked to beginning of the current bull market. No one quite knew what the 37 point one-day jump (huge at the time) in the DJIA that sultry August afternoon really signified, but it certainly was a watershed day of epic importance.
So too do we find the decline of the Nasdaq on January 24 to probably be a watershed event: an "outside day down" formation that left little doubt whether the recent slide of the DJIA or the ongoing froth of the Nasdaq is going to end up dominating our financial future.
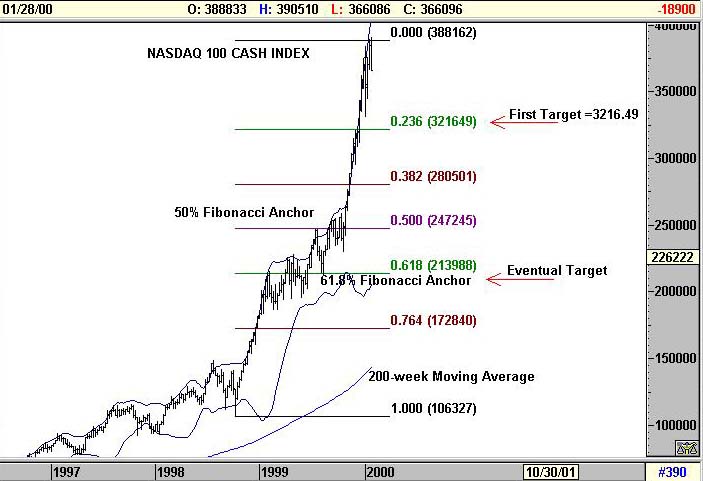
Although we can make a case for the broader Nasdaq composite index to make further highs, and maybe even the NY Stock Exchange Index (neither of which sport an entirely satisfactory and complete-looking "Fibonacci rhythm" to their recent highs), we think the Nasdaq 100 index DOES look relatively complete. It thereby joins the DJIA and S&P 500 in this regard. The high daily close Friday now nicely anchors highs and lows established on the ascent at the 50% and 61.8% levels. 3216.49 should be a level that we could easily visit in the not-too-distant future. 2139.88 would represent an eventual target that would also mark the approximate level of the Bollinger bands pictured above. Now wouldn't that cause the "new paradigm" bulls to pause for thought.
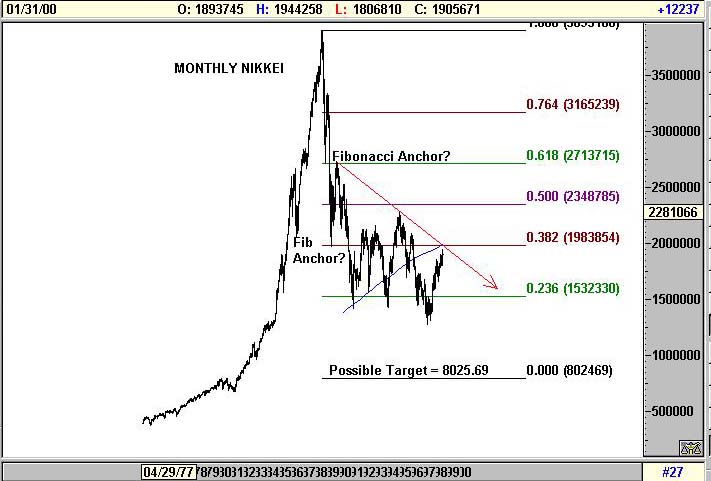
Meanwhile, halfway around the world, the rally in the Nikkei that has transpired since 1998 is now not that far away from its 200-month moving average that stands at approximately 19,838. Also, despite the rally from the 1998 lows transpiring in a 5-wave fashion, we do not like the overall complexion of this chart. Unless the 200-month moving average can be surmounted (which we believe is highly unlikely), it appears that all of the Nikkei's strength from late 1998 is probably little more than a contertrend rally within an ongoing bear market. Not to scare anyone, but using the 1990 low and 1991 high of the Nikkei respectively as Fibonacci "anchors," an ultimate low here of 8025.69 can be extrapolated sometime in the distant future. It has taken gold over 20 years to slowly recover from its bubble blow-off in 1980. If it takes the Nikkei a similar period of time, a lasting low would not form here until after 2009.
Isn't it amazing what a bit of longer term chart perspective can hold? Nasdaq lovers take note.
Am I wrong about this? Please post your comments in the Sandspring.com chatroom.
Thank you for visiting Sand Spring Advisors LLC, Inc. We hope to hear from you again soon. For more information on Sand Spring Advisors actual programs, services, or to request a copy of a Disclosure Document, please phone us at 973 451 0016, FAX your request to 973-451-0016, or e-mail us at
SandSpringAdv@AOL.com| Corporate Office: 10 Jenks Road, Morristown, NJ 07960 Phone: 973 451 0016 Facsimile: 973 451 0016 |
Best Experienced with
The material located on this website is also the copyrighted work of Sand Spring Advisors LLC. No party may copy, distribute or prepare derivative works based on this material in any manner without the expressed permission of Sand Spring Advisors LLC
This page and all contents are Copyright © 1999 by Sand Spring Advisors, LLC, Morristown, NJ