
The Chart du Jour
Dangerous Dell
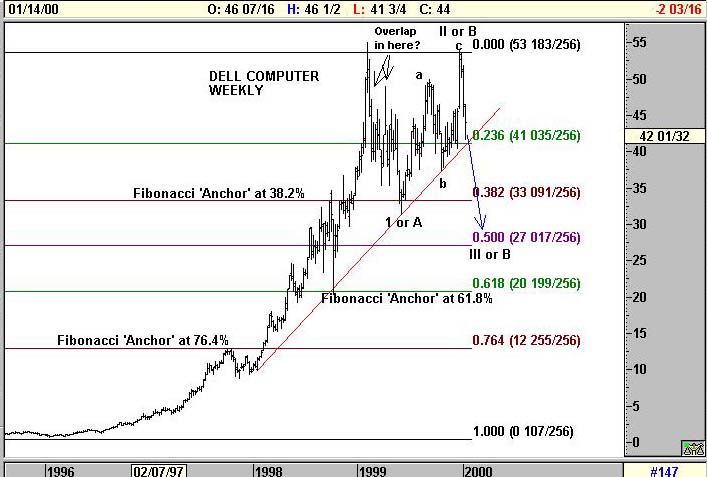
We were just staring at the weekly trendline pictured above in Dell Computer, contemplating how vulnerable it might be, when Dell offered an earnings warning for the 4th. quarter.
Why this should be a surprise to anyone, we do not know. Corporate purchasing of new PCs peaked in momentum all the way back in the 2nd. Quarter of 1999, and PC prices (and hence profit margins) have done nothing but go down ever since. The combined whammy hurt Dell in the 4th. Quarter, and it will continue to hurt Dell in the year 2000. Companies that spent a great deal of money replacing old PC's in anticipation of Y2K are now all set. Business unit sales are going to fall off a cliff.
And so it is that we turn to the weekly Dell chart pattern which of late has been a sloppy one. Do not let any Elliottician tell you that the price behavior here between last spring and now is particularly easy to interpret. The only clear thing about this chart if that the Fibonacci rhythm of the overall advance DOES look complete given all the Fibonacci 'anchors' that exist in our past price action. This is a concept that we have shown on several occasions recently, and is generally a good tool to know whether a lasting top has in fact been made. On this basis, we would say that a signficant top is in place.
Unfortunately, that is where the clarity of interpretation ends. The move down from January 1999 to June 1999 could have been a Wave I except for some slightly irritating overlap that may have occured between wave (1) and (4) of that move. If it was a Wave I, then everything since is a clear a-b-c Wave II, and we now face a potential Wave III collapse.
If -- perhaps more in line with traditional Elliott analysis that precludes any wave 1 and 4 overlap -- one labels the January 1999-June 1999 decline as a Wave A down, then the rally up into December 1999 was a wave B which itself sub-divided into an a-b-c type structure. This would still call for a move lower in a final Wave C down that would marginally break our 1999 lows and finish the entire corrective structure.
Whichever Elliott interpretation that one takes, the immediate implication is thankfully the same. A break of the weekly trendline should usher in dramatically lower prices. We see $27 as a logical target for a Wave C to complete and a minimum target should we in fact be dealing with a Wave III down instead.
It looks like rocky times in Austin, Texas for awhile. Keep in mind that the book value of Dell remains less than $3 per share for anyone who still deigns to believe in "Graham and Dodd style" fundamental equity analysis.
Am I wrong about this? Please post your comments in the Sandspring.com chatroom.
Thank you for visiting Sand Spring Advisors LLC, Inc. We hope to hear from you again soon. For more information on Sand Spring Advisors actual programs, services, or to request a copy of a Disclosure Document, please phone us at 973 451 0016, FAX your request to 973-451-0016, or e-mail us at
SandSpringAdv@AOL.com| Corporate Office: 10 Jenks Road, Morristown, NJ 07960 Phone: 973 451 0016 Facsimile: 973 451 0016 |
Best Experienced with
The material located on this website is also the copyrighted work of Sand Spring Advisors LLC. No party may copy, distribute or prepare derivative works based on this material in any manner without the expressed permission of Sand Spring Advisors LLC
This page and all contents are Copyright © 1999 by Sand Spring Advisors, LLC, Morristown, NJ