
The Chart du Jour
Most Markets Just Beginning,
but Others Close to Being Temporarily Done
The above said, in this ever more complicated world that we live in, it seems that we are getting sector-specific indices trading well out of "synch" with the broader market trends. This is nowhere more obvious than a comparison of the current Dow Jones Transportation Average (DJTA) with the Japanese Nikkei.
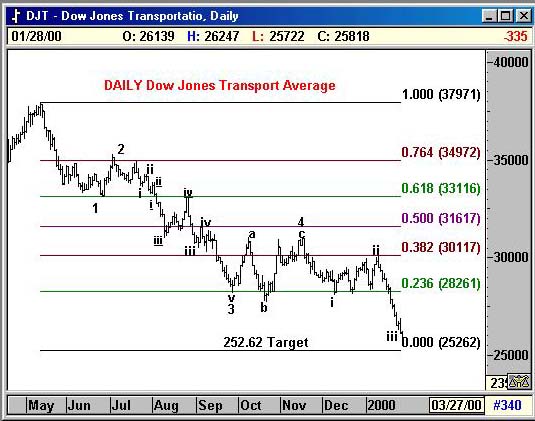
In the former instance, the DJTA began actually began its decline last May, and has sketched out an almost picture-perfect 5-wave descent. The index is likely to now be in the latter stages of wave iii of 5, and we spy an extrapolated Fibonacci support zone basis the daily rhythm of this chart at 252.62. In other words, we should be closer to finishing a 5-wave decline in the DJTA as opposed to beginning a free fall. 252.62 may not be a lasting low longer term, but once reached, it certainly should bring some repreive to this market in the short term. It could easily mark the end of a 5-wave downmove that we could label either as a larger I or A wave, to be followed by a substantive 2 or B wave bounce. We would look for a modest bounce in the S&P 500 at the same time when this transpires.
Meanwhile, over in the Far East, most equity markets have to date tried to shrug off the recent U.S. declines. Nowhere has this been more true than the Japanese Nikkei which closed right on its recent highs last Friday.
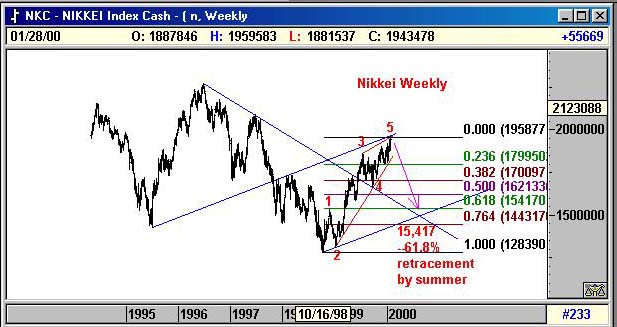
The picture here is equally clear, though. Despite the fact that the Nikkei has launched a 5-wave advance since 1998, that advance should be in its final stages, and is likely to be followed by a significant retracement. We previously spoke of the 200-month moving average capping this market no higher than 19,831, and we still feel strongly that this will be the case. To balance the look and steepness of the recent ascent, we actually believe a deep downmove is probable that will retrace at least 61.8% of the gains in this index since 1998. The positioning of the weekly trendlines drawn above adds further evidence that a downside target toward 15,417 is likely by summer.
So within this complex world, the monthly S&P is in the process of delivering a powerful negative message, but the DJTA is closer to a region of support than it is to further collapse. And the Nikkei may be trying to act oblivious to it all for the moment, but on a percentage basis, it actually may be one of the more vulnerable markets around.
Twist and turn, flail and drop, capital is slowly beginning a path toward sudden evaporation.
Am I wrong about this? Please post your comments in the Sandspring.com chatroom.
Thank you for visiting Sand Spring Advisors LLC, Inc. We hope to hear from you again soon. For more information on Sand Spring Advisors actual programs, services, or to request a copy of a Disclosure Document, please phone us at 973 829 1962, FAX your request to 973 829 1962, or e-mail us at
info@Sandspring.com| Corporate Office: 10 Jenks Road, Morristown, NJ 07960 Phone: 973 829 1962 Facsimile: 973 829 1962 |
Best Experienced with
The material located on this website is also the copyrighted work of Sand Spring Advisors LLC. No party may copy, distribute or prepare derivative works based on this material in any manner without the expressed permission of Sand Spring Advisors LLC
This page and all contents are Copyright © 1999 by Sand Spring Advisors, LLC, Morristown, NJ