
The Chart du Jour
When the Curve Inverts
Now is this all good news or bad news? No one quite seems too sure. Rumors were swirling through the markets today of a primary dealer in duress, and of traders and strategists at a big money center bank being shown the door. And yet surely it was previously the bond market going down for so long that was the biggest bane of all those equity bulls. How could a rally in the back end of the fixed income markets possibly be something unfortunate, particularly if it is fueled in part by increased demand for our debt from abroad?
First some history on prior yield curve inversions.
Inversions as a phenomenon have occured on just three occasions in the past twenty five-years: first, in mid 1973 just in front of the first Arab oil embargo and a rather nasty equity bear market into 1974; second, in January 1979 just in front of the second oil shortage and the explosion of commodity prices into the first quarter of 1980; and lastly in late-1989 slightly in advance of the Gulf War and a recession that would last just long enough to turn George Bush into an unpopular and un-reelected President.
Each instance had its own particular traits. 1973 and 1978 had seen the dollar under severe pressure, while in 1989 the dollar was already rebounding from its post-1987 crash lows. Each period also had certain similarities. Not only were commodity prices rising in each of the three prior instances (with oil to eventually explode higher on all three occasions), but the U.S. current account was severely negative in all three instances just as it is today. Overt Fed tightening to raise real interest rates in all three instances slowly led to dollar rallies and an improved current account, but not without some equity market pain as well.
Now we do not want to get involved at the moment forecasting whether the recently inverted curve is going to retrace a bit or continue to blow itself out. Suffice it to say that once inverted, and with commodity markets firm, we find it highly unlikely that the recent shift will come completely undone anytime soon. In general, the situation in the year 2000 is oh-so similar in many ways to 1973, 1979, and 1989, but yet a little different. The situation in Japan makes it different as we have previously discussed, and the situation with the dollar against Europe is also very different.
The dollar has been the currency of choice against the euro since its inception. There are structural reasons why this is so. If we are now adding to that equation an inverted U.S. yield curve, this should truly send our currency vaulting ever higher against the euro, even as the inverted curve slowly impinges upon the over-leveraged health of our domestic economy.
So there it is: the end-all of our analysis on the inverted curve -- the dollar flies while the U.S. economy weakens, commodities stay firm, while the public's love affair with equities should slowly diminish -- a twisted and somewhat perverse scenario that we don't see often, but that we are likely to see now.
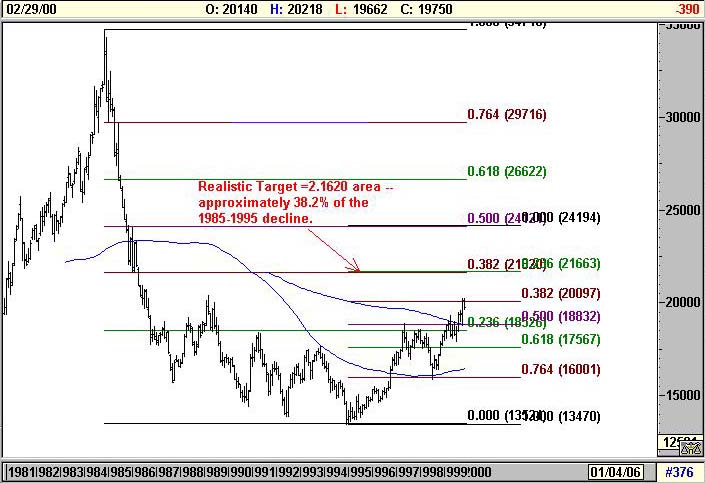
And finally for a chart or two. Basis the old Deutsche mark cash chart (which we prefer to analyze technically due to its longer-date clean data series compared to the fudged past data of the new euro), 2.1620 should be a minimum target, and 2.4120 possible over time. In euro terms this equates to .9046 and .8109 respectively!
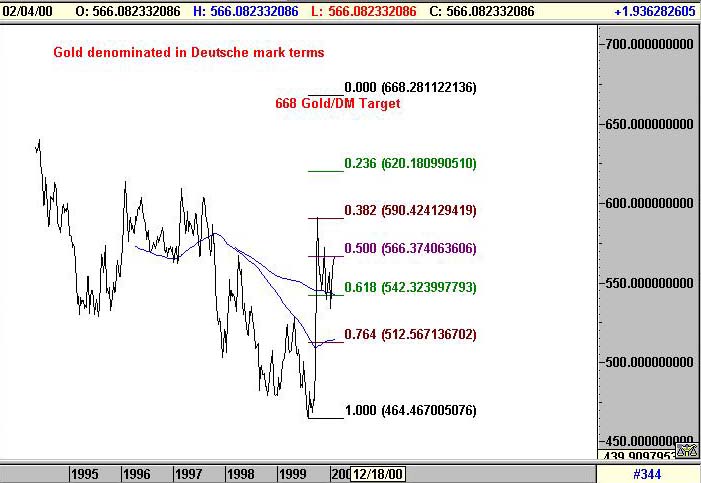
Gold denominated in Deutsche marks looks even more powerfully poised, with a potential 668.20 DM Fibonacci target. If the DM were to reach its first 2.1620 target at the same time as gold/DM reachs its target, gold on a cross basis can be calculated to reach $309 per ounce -- a perfectly reasonable and realistic price.
Oh, and by the way: inverted yield curves historically have only caused equity markets to becomed more volatile, not less. Clinton may be dashing from the White House next January just in time to avoid something of a financial mess.
Am I wrong about this? Please post your comments in the Sandspring.com chatroom.
Thank you for visiting Sand Spring Advisors LLC, Inc. We hope to hear from you again soon. For more information on Sand Spring Advisors actual programs, services, or to request a copy of a Disclosure Document, please phone us at 973 829 1962, FAX your request to 973 829 1962, or e-mail us at
info@Sandspring.com| Corporate Office: 10 Jenks Road, Morristown, NJ 07960 Phone: 973 829 1962 Facsimile: 973 829 1962 |
Best Experienced with
The material located on this website is also the copyrighted work of Sand Spring Advisors LLC. No party may copy, distribute or prepare derivative works based on this material in any manner without the expressed permission of Sand Spring Advisors LLC
This page and all contents are Copyright © 1999 by Sand Spring Advisors, LLC, Morristown, NJ