
The Chart du Jour
GBLX: A Multiday Coil
As readers of this column know, we were very bullish "gold denominated in yen" and "gold denominated in deutsche marks" in the middle of last week. Friday's substantive gold rally was a slightly fortuitous example of instant gratification.
We also suggested last week that a daily close above 1428 in the March S&P would reopen the upside of the U.S. stock market. Such a close occured, but we have yet to see any real upside follow-through or momentum. The hourly chart still allows for numerous different Elliott wave interpretations. The case for the bulls has improved somewhat but we would not call it compelling -- at least not yet.
One chart we would keep a close eye on as a harbinger of the overall equity market is stock Global Crossing (GBLX). Although it may be hard to discern on the charts below, this stock left four back-to-back "inside days" last week -- tighter and tighter ranges inside each other -- before a lackluster nudge to the upside Friday, but with a weak close.
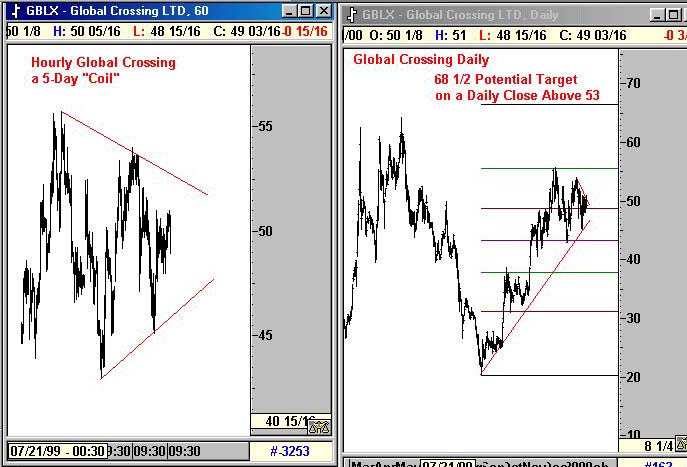
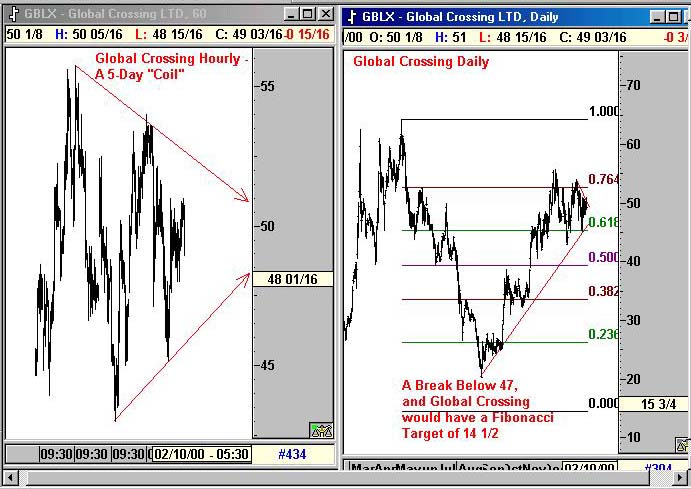
From twenty years of trading experience we have learned that such patterns happen only occasionally, but offer a superb focus point to determine the next big trend. Whichever way we break out of this coiling formation will be our next trend not only in GBLX but most likely for the entire market for several weeks. If Global Crossing can get above the depicted downtrend line that we have conservatively labeled at about 53, then this stock will be headed to slightly above 68, and the whole equity market is likely to go with it. If however, this "coil" formation were to break down in the next few days, breaking the lower trendline near 47, then the Fibonacci rhythm would suggest -- 14 1/2!
Now surely you will say, this company must have some intrinsic value well above 14 1/2, particularly if we note the possibility that it could reach 68, but that is the entire problem with the current bull market. Nobody knows what "fair value" really is. Just remember Lucent and its sudden 25% one-day decline. Traditional fundamental yardsticks haven't been working for awhile now, and the opinions of Wall Street's best analysts are biased and suspect at best. We honestly wouldn't be surprised to see this stock trade at both extreme prices within the next year.
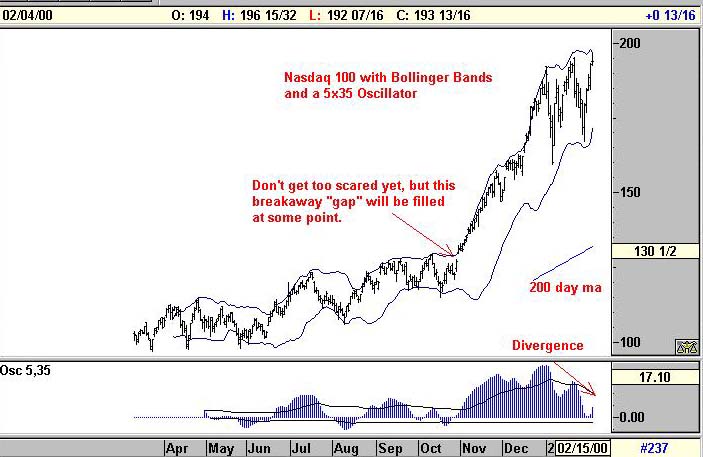
Maybe there is an option strategy out there to bet on such two-way volatility over time, but at a minimum, keep an eye on this stock in the short term. How this coiling formation resolves itself -- the next $3 move -- should hold greater portents for the market as a whole. If we break higher, get out of the way of the bull train until GBLX reaches 68. If we break lower, then the chart below of the Nasdaq will be "three thrusts to a marginal new high" and then a collapse to eventually fill our October 1999 breakaway gap. How ugly.
Am I wrong about this? Please post your comments in the Sandspring.com chatroom.
Thank you for visiting Sand Spring Advisors LLC, Inc. We hope to hear from you again soon. For more information on Sand Spring Advisors actual programs, services, or to request a copy of a Disclosure Document, please phone us at 973 829 1962, FAX your request to 973 829 1962, or e-mail us at
info@Sandspring.com| Corporate Office: 10 Jenks Road, Morristown, NJ 07960 Phone: 973 829 1962 Facsimile: 973 829 1962 |
Best Experienced with
The material located on this website is also the copyrighted work of Sand Spring Advisors LLC. No party may copy, distribute or prepare derivative works based on this material in any manner without the expressed permission of Sand Spring Advisors LLC
This page and all contents are Copyright © 1999 by Sand Spring Advisors, LLC, Morristown, NJ