
The Chart du Jour
Further Guideposts To Quantify
Just Where the Nasdaq's Wild Ride May End
In good conscience we cannot advocate buying stocks given the extent of the longer term bubble, but we can advocate trying to avoid getting flattened by this unstoppable Nasdaq upside assault. We can also point to further technical guideposts that once achieved -- whether in two days or two months -- would make us look at the short side of this market once again.
In addition the the 68 1/2 Fibonacci target for GBLX, we spy a 147 7/8 potential Fibonacci target for Cisco basis its monthly chart. We also spy a 128 3/4 target for Intel basis its monthly chart.
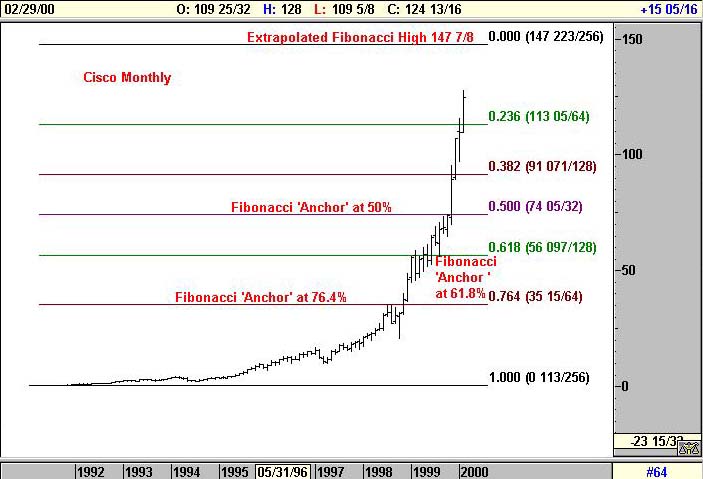
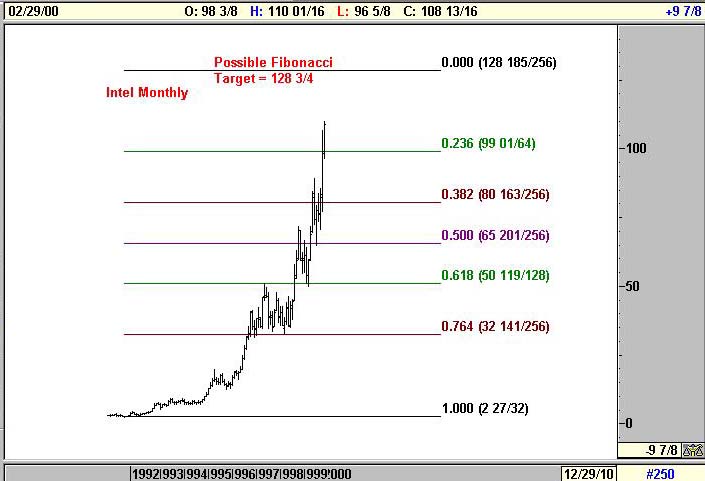
Now, since these two stocks are among the last select list of popular names that are carrying this insatiable bull, it makes sense to us watch for these extrapolated targets as a method to re-time the Nasdaq's ever-evasive finale. These targets are both approximately 20% higher than current levels which would certainly make for one wild blow-off. In an ideal world, 68 1/2 on GBLX, 147 7/8 on CSCO, and 128 3/4 on INTC might all occur within a day or so of eachother. If so, we would once again feel strong confidence to put out some S&P and Nasdaq shorts. For the moment, however, we can only be so prudent as to step aside and continue to watch these flabbergasting times -- but do so from the relative safety of the sidelines.
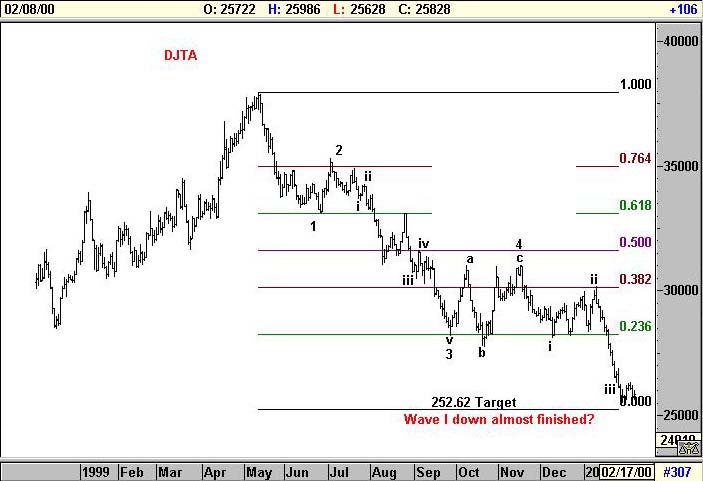
One final note: a blowoff in the Nasdaq to the upside at this time would probably occur with a strong II wave rally in the Dow Jones Transports which now appears close to a completed 5-waves down from last April. It would also allow for a period of time during which capital from abroad would feel compelled to finally join the U.S. party. Thereafter these indices would then be in better synch, as the the Nasdaq would be ready for a wave I down while the DJTA falls over into a Wave III collapse. We remain bearish longer term, but quietly lick our wounds until the short term technicals once again appear compelling.
To see how it feels as a long term bear to have written the above analysis, you may click here.
Am I wrong about this? Please post your comments in the Sandspring.com chatroom.
Thank you for visiting Sand Spring Advisors LLC, Inc. We hope to hear from you again soon. For more information on Sand Spring Advisors actual programs, services, or to request a copy of a Disclosure Document, please phone us at 973 829 1962, FAX your request to 973 829 1962, or e-mail us at
info@Sandspring.com| Corporate Office: 10 Jenks Road, Morristown, NJ 07960 Phone: 973 829 1962 Facsimile: 973 829 1962 |
Best Experienced with
The material located on this website is also the copyrighted work of Sand Spring Advisors LLC. No party may copy, distribute or prepare derivative works based on this material in any manner without the expressed permission of Sand Spring Advisors LLC
This page and all contents are Copyright © 1999 by Sand Spring Advisors, LLC, Morristown, NJ