
The Chart du Jour
In our analysis "Three Peaks and a Domed House - Revisted," we correctly labelled the absolute top of the DJIA using a chart pattern structure first described by famed market technician George Lindsay in the 1960s. This high was just 2% above the idealized high Leonardo Fibonacci would have predicted back in the 13th. Century had he been given the various peaks and troughs of the Dow's ascent since inception. The high occured with a structure George Lindsay claimed to have found on numerous occasions in history at the end of long "extended" bull markets.
We do not want to give away all the work that we put into that analysis to non-paying readers, but suffice it to say that we now believe Lindsay's "point 26" is quickly being approached. We previously pointed to some support in the DJIA at 10,388, a level we succeeded in holding by the close Friday, but if the big-time bear move is truly on the prowl (and we certainly think it may be), we could now see a spike lower to 10,093 where Lindsay's "point 26" would definately hold on first touch.
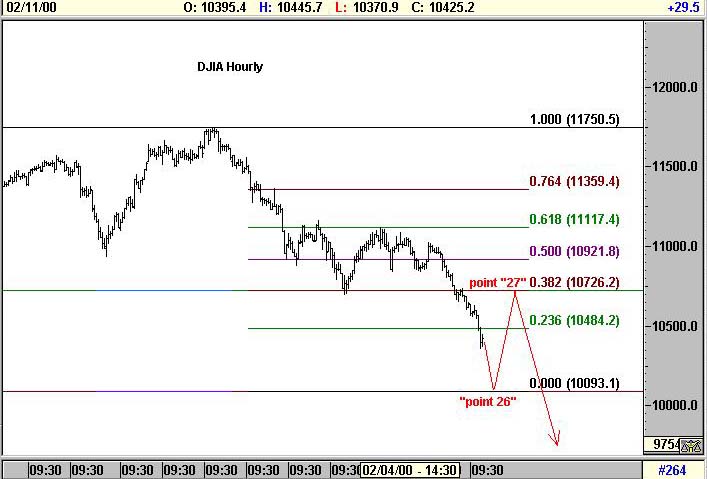
Basis the Fibonacci rhythms, one would then look for a very sharp rally to "point 27," with 10,726 being the specific level near which we now believe any short term rally will fail. It is during this bounce phase however that a handful of high tech stocks such as Global Crossing (as previously discussed) could lurch to one final new high -- with GBLX specifically slated to reach at least $66. Whether the broader Nasdaq Composite or Nasdaq 100 indices will also be able to make new highs, we now increasingly doubt, but we previously vowed not to impale ourselves trying to forecast the end of the high tech mania.
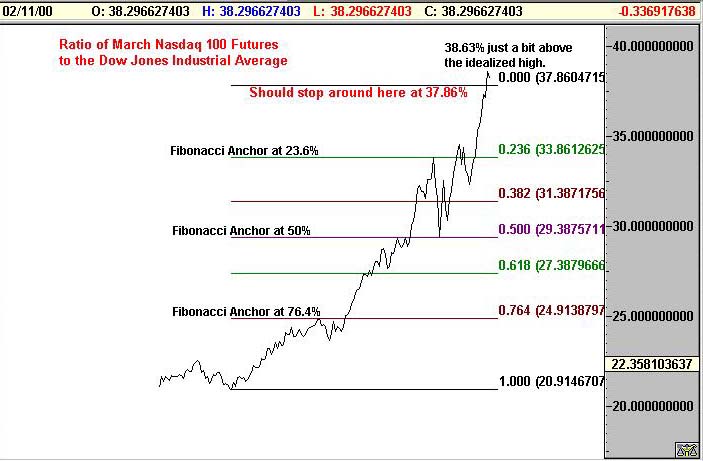
Certainly from an anecdotal point of view, the very muted reception Pets.com received after its IPO Friday may be the first step toward Amazon.com's demise. In addition, the ratio of the Nasdaq 100 to the DJIA reached 38.63% on February 10th and that is about as far as we imagined it could run.
All of this sounds horribly sloppy of course, and it will be. We can almost hear CNBC already cheering wildly when -- after a Monday or Tuesday drubbing -- equities launch some sort of sharp 300-700 point rebound from the dead. The rally will not hold however. It should be a last gasp -- a final burst of strength from the bulls for a long while. Once "point 27" is in place, in Elliott terms we can imagine a I-II... structure, with a III-wave decline somewhere behind it. "Point 27" to "point 28" might well be termed going into "crash mode." From a timing perspective, we could get to that point as soon as the end of February, or perhaps as late as May should "point 27" turn into an extended range-bound affair. In either case, the topside should be severely limited now by 10,726.
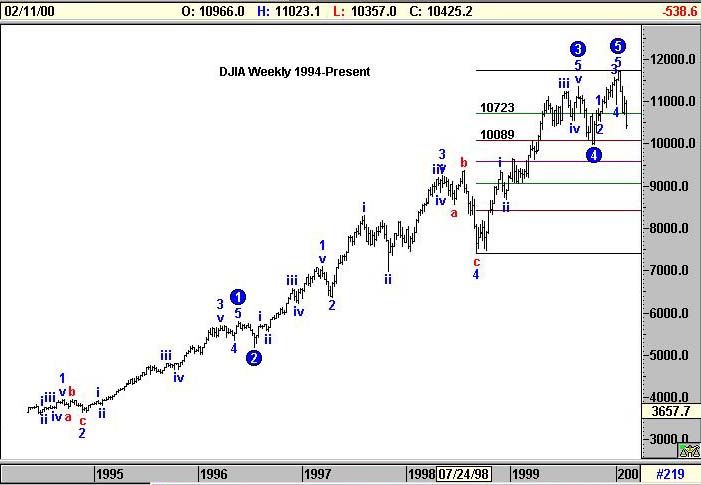
On a slightly longer term perspective, we allowed the "GET system" to label the Elliott waves of the 1994-2000 DJIA advance. Letting a computer construct an Elliott count often produces spurious results on the smaller intervening jiggles, but to one's broad eye, the overall count produced certainly looks like a reasonable one. A completed 5th wave is almost certainly in place. In addition, the previous 4th wave weekly low was 9976, so our extrapolated "line in the sand" at 10,093 basis the hourly chart makes perfect sense as a temporary bottom. Prices would find support just above the low of the previous 4th. wave as depicted on a weekly basis.
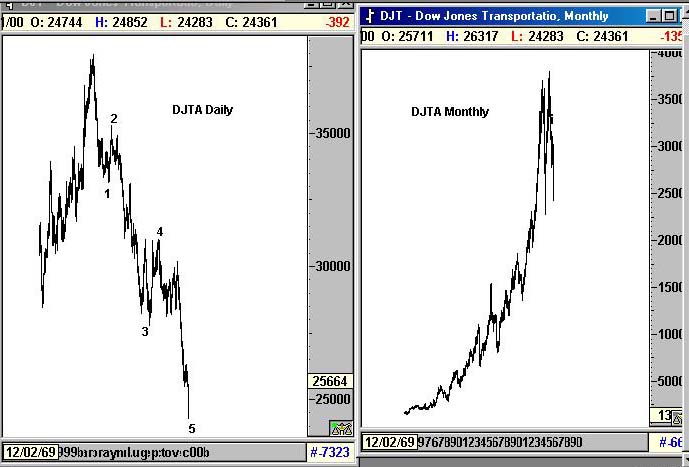
Of all the indices, we still see the DJTA as the potential best relative value if one had to be long something, but alas, prices have now fallen well below our anticipated Fibonacci downside target of 252.62. The daily chart still looks like a completed 5-wave down structure (somewhat remicent of the way the bond and euro charts looked in late 1994), but it is probably best to put everything in perspective and remember that on a monthly basis (as pictured on the right below), we are still at very lofty levels. Since the DJTA has been beaten up the most of late, it is simply probable that this index will experience the biggest relative recovery when the near-term relief rally finally comes.
For a full understanding of George Lindsay's "Three Peaks and a Domed House" we invite you to receive the entire article by going to our shopping cart below and ordering our newest analysis "Nasdaq Crash and First Stopping Point." After the secure processing of your credit card, you will receive an immediate confirmation of the transaction, and your article will follow shortly thereafter by e-mail -- usually within a few hours.
Sand Spring Advisors provides information and analysis from sources and using methods it believes reliable, but cannot accept responsibility for any trading losses that may be incurred as a result of our analysis. Individuals should consult with their broker and personal financial advisors before engaging in any trading activities, and should always trade at a position size level well within their financial condition. Principals of Sand Spring Advisors may carry positions in securities or futures discussed, but as a matter of policy will always so disclose this if it is the case, and will specifically not trade in any described security or futures for a period 5 business days prior to or subsequent to a commentary being released on a given security or futures.
Order our second article as well, and get a 20% discount on both.