
The Chart du Jour
We thought it prudent for a moment to review two prior discussions, one regarding palladium and the other crude.
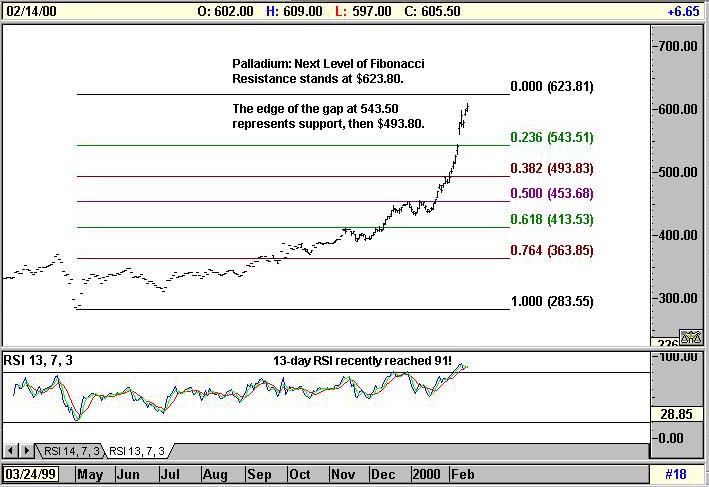
In palladium we previously suggested that resistance should exist at $508 basis Fibonacci rhythms of its advance, but the market vaulted through this level like a hot knife through butter, and we have restretched our Fibonacci bands to the next level of potential resistance. This equals $623.80. We can hardly believe that we are writing figures so high. In palladium and platinum at least it feels like 1980. Even so, the 13-day daily RSI on this chart recently reached 91. Anyone astute enough to have stayed long this market are advised to book profits and move on to the next trade, particularly should the $623.80 target be touched.
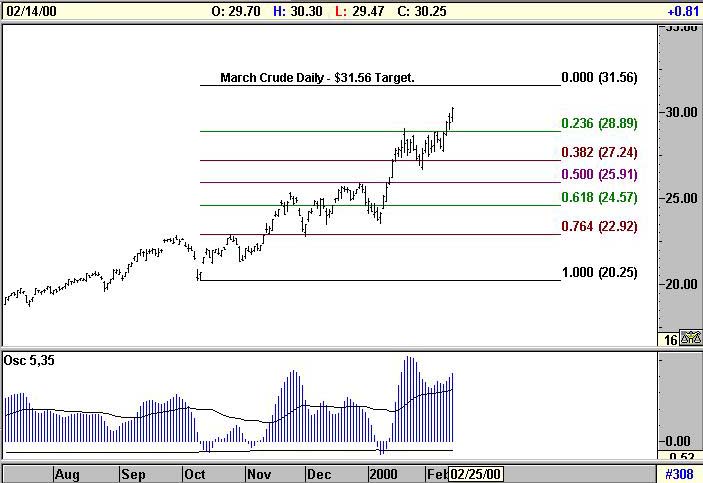
Meanwhile, over in the Crude oil, we previously suggested that the Fibonacci rhythm of the advance on a weekly basis would lead us toward $32.50. Basis the daily chart below, $31.57 also pops up as a logical target as measured from the early October lows. We will stick by this band of resistance to potentially cap a 5th. wave rally as measured on a weekly chart from the December 1998 low.
Perhaps such a final lurch higher will be just enough to undermine U.S. bonds and equities such that we can achieve our short term 10,093 target in the DJIA. Then the commodity markets are likely due for a pause, and the equity revelers could easily return for a "last hurrah" rally that would take the DJIA back up to 10,725.
If you liked the short discussion above, you are sure to enjoy some of our longer more in-depth articles offered for sale below. Please support Sand Spring Advisors by subscribing either on a pay-per-view basis or on an annual basis. Upon the proper processing of your credit card you will be provided with an immediate receipt, and your article will follow by e-mail within several hours.
Sand Spring Advisors provides information and analysis from sources and using methods it believes reliable, but cannot accept responsibility for any trading losses that may be incurred as a result of our analysis. Individuals should consult with their broker and personal financial advisors before engaging in any trading activities, and should always trade at a position size level well within their financial condition. Principals of Sand Spring Advisors may carry positions in securities or futures discussed, but as a matter of policy will always so disclose this if it is the case, and will specifically not trade in any described security or futures for a period 5 business days prior to or subsequent to a commentary being released on a given security or futures.
Order our second article as well, and get a 20% discount on both.
| Corporate Office: 10 Jenks Road, Morristown, NJ 07960 Phone: 973 829 1962 Facsimile: 973 829 1962 |
Best Experienced with
The material located on this website is also the copyrighted work of Sand Spring Advisors LLC. No party may copy, distribute or prepare derivative works based on this material in any manner without the expressed permission of Sand Spring Advisors LLC
This page and all contents are Copyright © 2000 by Sand Spring Advisors, LLC, Morristown, NJ