
The Chart du Jour
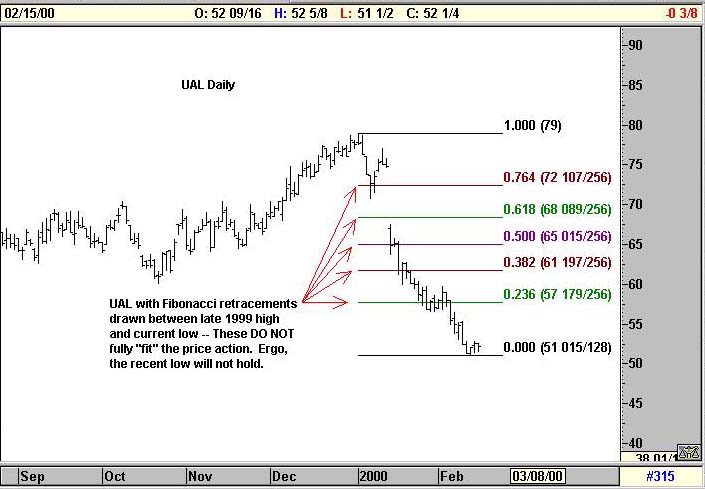
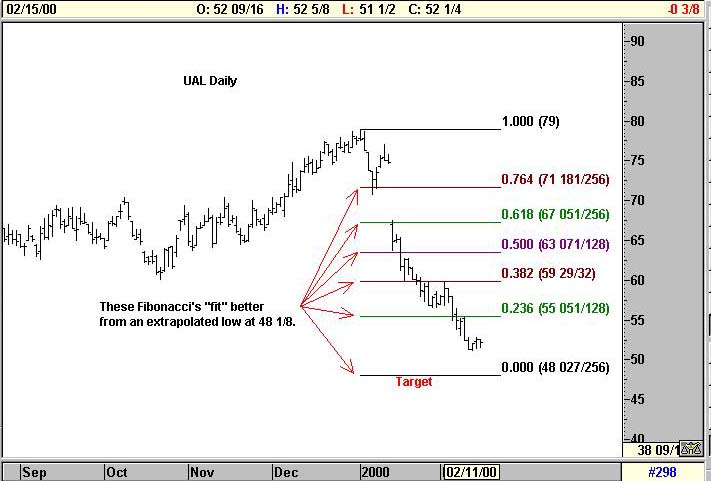
Now look instead at the chart of UAL with our Fibonacci retracement levels drawn to an extrapolated low of 48 1/8. They "fit" our recent price action much better. While there are certainly other levels under 48 1/8 that would also leave the Fibonacci rhythm of this chart acceptable, 48 1/8 is the first minimum level that UAL should reach. Should it do so at the same time as crude reaches our first $31.56 Fibonacci target (see yesterday's Chart du Jour), one could have a potentially powerful indication that oil is topping out while UAL (and the DJTA) are finally marking at least a temporary low.
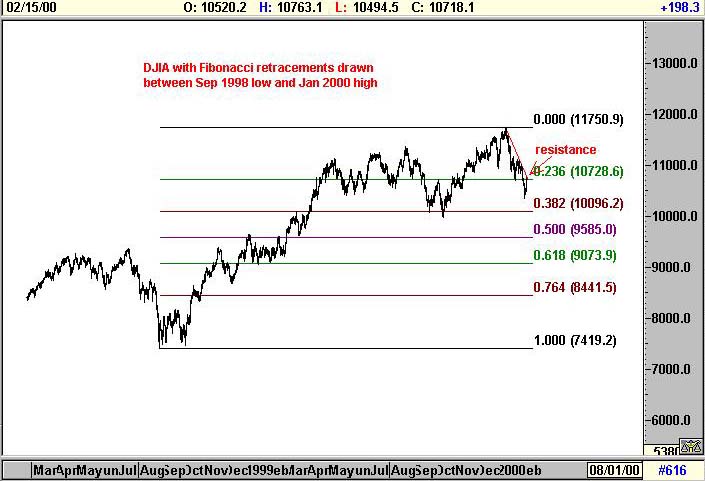
Meanwhile, over in DJIA-land, instead of going down to 10,093 and then up to 10,725 as anticipated, the DJIA has rallied straight to 10,725 first -- a non-trivial difference. We still see significant resistance here, however, and stand by our bearish analysis in "Three Peaks and a Domed House" (available for purchase below) that has been excellent to date. The long term analysis presented in "A Thirteenth Century Mathematician and the Current Rhythm of the DJIA" also offers further support of a longer term bearish view.
For reasons beyond the discussion here, only a weekly close above 10,827 would call into question the longer-term bearish thoughts from both of these articles. We will discuss these implications if and when they occur. For the moment, within a disjointed stock-pickers market where UAL is still headed down to at least 48 1/8 while stocks like GBLX still vault higher (we maintain a $66-$68 target -- see the 2/5/00 Chart du Jour), the overall tone of equity financial health remains highly suspect. Someday maybe all of these indices will align themselves a bit better in a uni-directional descent or advance, but for now, we wouldn't advise holding one's breath.
If you liked the short discussion above, you are sure to enjoy some of our longer more in-depth articles offered for sale below. Please support Sand Spring Advisors by subscribing either on a pay-per-view basis or on an annual basis. Upon the proper processing of your credit card you will be provided with an immediate receipt, and your article will follow by e-mail within several hours.
Sand Spring Advisors provides information and analysis from sources and using methods it believes reliable, but cannot accept responsibility for any trading losses that may be incurred as a result of our analysis. Individuals should consult with their broker and personal financial advisors before engaging in any trading activities, and should always trade at a position size level well within their financial condition. Principals of Sand Spring Advisors may carry positions in securities or futures discussed, but as a matter of policy will always so disclose this if it is the case, and will specifically not trade in any described security or futures for a period 5 business days prior to or subsequent to a commentary being released on a given security or futures.
Order our second article as well, and get a 20% discount on both.