
The Chart du Jour
We have previously stated that we see some support basis the DJIA at 10,093. We have stated as well that the DJTA weekly chart has five waves down and may be getting overdone. But then the Nasdaq 100 hasn't even begun a descent yet, something that rather than being glorious, we actually find quite worrisome.
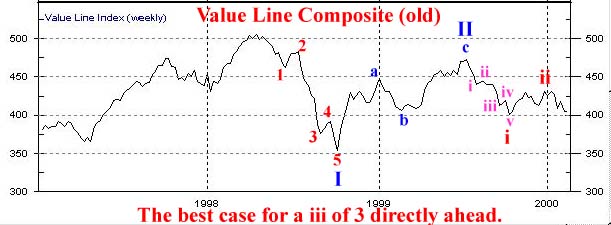
Somewhere in the middle, the old Value Line Index (which we typically do not look at) is sporting perhaps the most ominous looking wave count of all. Unable to ever even regain its July 1998 high, the Value Line Index on a monthly basis previously left a clean 5 waves down in a potential I or A wave. It then sketched out a non-impulsive a-b-c II or B wave. On a more minuette basis, we recently did another i-ii-iii-iv-v decline, followed by a small a-b-c bounce. To anyone who knows anything about Elliott waves, this certainly leaves the possibility for a 3 of C or 3 of III wave collapse directly in front of us.
Now we do not want to be alarmist, and we have previously suggested that the DJIA should find a likely bottom above its previous 4th. wave low at 9997. This is still our more high-probability view. But basis the Value Line alone, we would be on the watch for an equity acceleration to the downside over the next few days into next week. The mutual fund boys are so low in cash and so long the same small handful of stocks, that just a small nudge of public redemptions instead of bottom-picking (as has been the norm of course), could potentially wreak havoc at this time. It is never a high-probability tactic to call for a "crash," but we certainly see an increased risk of one in the Feb 21-28 time window. Holding above 9997 on the DJIA will be the key to telling the difference between a short term low and a more dangerous situation.
We have just finished an in-depth analysis of the longer term risks to equities that is eight pages in length and examines the Elliott wave pattern of the Nasdaq's Price-Earnings Ratio since 1995, as well as various analog pattern matches involving the Nasdaq. The report looks at mutual fund cash levels, mutual fund positioning, and changes in the monetary base. It sketches out a possible path for the Nasdaq if indeed the next few days prove as dangerous as the Value Line chart above implies.
We are quite proud of this analysis, and think that it may prove a valuable "roadmap" for trading over the balance of the year. This report is now available for $25 via credit card ordering below. Included with this report, for those subscribers who have not yet read it, we will now offer the previous analysis "Three Peaks and a Domed House" that was written January 14, 2000 (and has been working very well since then) for FREE. The two articles together offer some powerful evidence that a crash scenario is most certainly possible and perhaps closer than most realize. One may also subscribe on a quarterly basis to ALL articles past and present for just $55.
Sand Spring Advisors provides information and analysis from sources and using methods it believes reliable, but cannot accept responsibility for any trading losses that may be incurred as a result of our analysis. Individuals should consult with their broker and personal financial advisors before engaging in any trading activities, and should always trade at a position size level well within their financial condition. Principals of Sand Spring Advisors may carry positions in securities or futures discussed, but as a matter of policy will always so disclose this if it is the case, and will specifically not trade in any described security or futures for a period 5 business days prior to or subsequent to a commentary being released on a given security or futures.
Order our other article as well, and get a 20% discount on both.