
The Chart du Jour

Did anyone notice Friday, February 18, just how many things suddenly went wrong? Stocks opened higher, met relatively benign economic numbers, and then for no apparent reason started to drop like a stone. We had previously suggested that the Nasdaq was within a small zone where its Fibonacci rhythm looked relatively complete, and that the Value Line index looked poised for the potential beginning of a iii of 3 down. In short, for the first time in a while all the various indices got in synch with eachother, all pointed in one negative direction.
Indeed, the Nasdaq 100 actually succeeded in making its third "outside day down" formation within the last month. This "three thrusts to a final high" type of pattern is a relatively common one, with the lower volume on each of the last three thrusts confirming that an important top is likely in the making. In the chart below, we have marked each of the "outside day down" formations we could find for the Nasdaq since late 1998. We also note on this chart the strange coincidence that two out of five came on a full moon, one out of five on a new moon, and our last one also came with major solar flare activity.
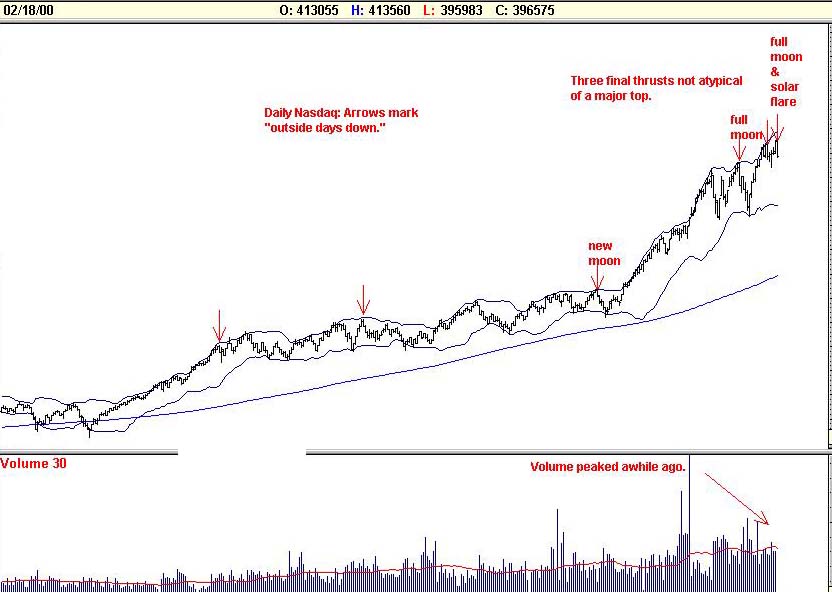
You see not only were things going horribly wrong on Earth Friday -- with a major snow storm weighing down the U.S. east coast, a major underground explosion rocking Washington D.C. to the extent that manhole covers went flying into the air, airline computer systems collapsing together with those of the Nasdaq, and Charles Schwab's online trading going off line for about an hour -- but the heavens were active as well.
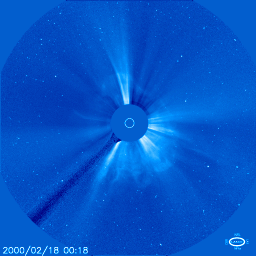
In addition to having a full moon on Feb 18th, NASA reported that on February 17th a medium-sized solar flare erupted from a sunspot group near the middle of the solar disk. It was accompanied by a "coronal mass ejection" that can carry up to 10 billion tons of plasma travelling at speeds as high as 2000 kilometers a second. This one happens to be headed directly toward Earth, and while we have already been bombarded within minutes of the sun's explosion by its energetic particles and radiation, the slower moving material from the coronal mass ejection is only scheduled to collide with our atmosphere February 20th. While not dangerous to life, such occurences in the past have been linked to geomagnetic storms, satelite communication failures, and in extreme cases, problems with electric power transmission equipment.
We mention all of this simply in passing and with academic curiousity. The old Egyptian-Sumerian belief and saying "As above, so below" may be relevant in the current instance. Something went "pop" in the equity markets Friday at almost the same moment that something went "pop" in a big way in our solar system. Maybe it's just a coincidence. Maybe it's more. I for one am the proud father of three children -- each of which was born exactly on a full moon day. Now tell me that the moon's pull doesn't have something to do with human behavior and specifically my wife's hormones and body. And if the moon can help induce the labor of child birth, perhaps an explosion on the sun can effect us all.
We think next week will be a nasty one for equities that will lead the DJIA at least to 10,093 and perhaps considerably further. It is not the time to bottom pick. It is time to get out of the way of what could easily be a powerful reversal DOWN.
Per the picture below, a true bear market has likely arrived.
 We have just finished an in-depth analysis of the longer term risks to equities that is eight pages in length and examines the Elliott wave pattern of the Nasdaq's Price-Earnings Ratio since 1995, as well as various analog pattern matches involving the Nasdaq. The report looks at mutual fund cash levels, mutual fund positioning, and changes in the monetary base. It sketches out a possible path for the Nasdaq if indeed the next few days prove as dangerous as the Value Line chart above implies.
We are quite proud of this analysis, and think that it may prove a valuable "roadmap" for trading over the balance of the year. This report is now available for $25 via credit card ordering below. Included with this report, for those subscribers who have not yet read it, we will now offer the previous analysis "Three Peaks and a Domed House" that was written January 14, 2000 (and has been working very well since then) for FREE. The two articles together offer some powerful evidence that a crash scenario is most certainly possible and perhaps closer than most realize. One may also subscribe on a quarterly basis to ALL articles past and present for just $55.
Sand Spring Advisors provides information and analysis from sources and using methods it believes reliable, but cannot accept responsibility for any trading losses that may be incurred as a result of our analysis. Individuals should consult with their broker and personal financial advisors before engaging in any trading activities, and should always trade at a position size level well within their financial condition. Principals of Sand Spring Advisors may carry positions in securities or futures discussed, but as a matter of policy will always so disclose this if it is the case, and will specifically not trade in any described security or futures for a period 5 business days prior to or subsequent to a commentary being released on a given security or futures.
Order our other article as well, and get a 20% discount on both.