
The Chart du Jour
The bears can point with some relish at the five-minute chart of the Nasdaq 100 pictured below, and say "Ah ha! A clear five waves down are apparent, coming after an 'outside day down' formation Friday -- all very negative."
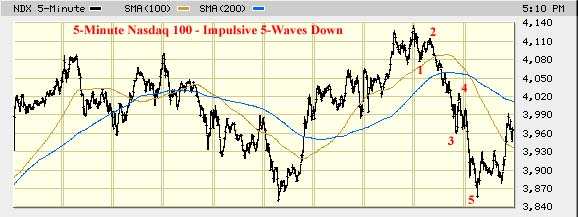
But equity bulls might point to the fact that the DJIA bounced so nicely off of 10,102, a level just above 10,093 that we previously suggested should offer some substantive support.
Both observations are perfectly correct, and both might even suggest a continued short term bounce as the Nasdaq does a partial retracement of it 5-waves down, and the DJIA puts a bit of breathing room between itself and the critical 9976 previous 4th wave low.
But as measured from the January 14th DJIA high, the DJIA just passed 25 trading days since its peak, having consistantly consistantly dribbled lower during that time. If history holds any lessons, and the crash of 1929 is any example, between 23 and 30 trading days after an equity peak, one can actually expect a small countertrend relief rally. Bottom pickers act as they have been taught -- jumping in at the first sign of a potential reversal. An eventual crash type scenario would actually be harder to achieve without first sucking in this crowd.
It is then beyond trading day 30, specifically trading day 34 onwards per the 1929 crash, that one has to start being wary once again of a renewed downside acceleration. Until this market can get beyond trading day 34 (on our calendars March 6), therefore, or alternatively back above its recent high at 10,769, we will treat this market with the utmost suspicion. The overall pattern still bodes more of a brewing waterfall decline than of a healthy bottom.
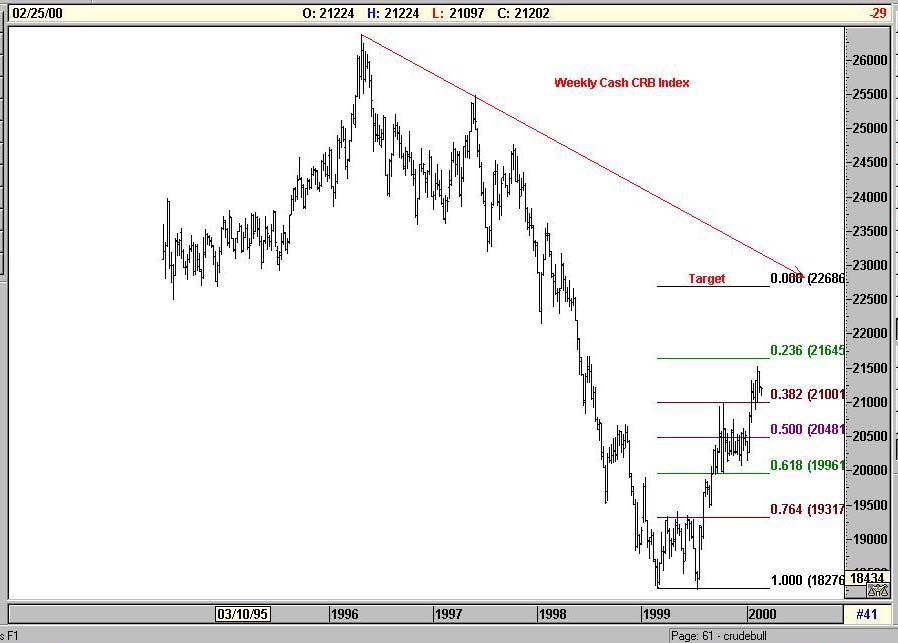
And what, pray tell, should cause this market to continue to roll over in a crash-like fashion, particularly from trading day 34 onwards? The only clear catalyst continues to appear commodities where we now spy the next Fibonacci target on the CRB at 226.86. The CRB just finished a 19-year decline during which its price almost halved. From its late 1999 double bottom the index is currently up just 16% or so. There is still a tremendous amount of room here for further advances, and the Fibonacci rhythm of the chart suggests as much. 226.86 would represent approximately a Fibonacci 23.6% advance from our recent lows - a more natural first stopping point than current levels.
 We have just finished an in-depth analysis of the longer term risks to equities that is eight pages in length and examines the Elliott wave pattern of the Nasdaq's Price-Earnings Ratio since 1995, as well as various analog pattern matches involving the Nasdaq. The report looks at mutual fund cash levels, mutual fund positioning, and changes in the monetary base. It sketches out a possible path for the Nasdaq if indeed the next few days prove as dangerous as the Value Line chart above implies.
We are quite proud of this analysis, and think that it may prove a valuable "roadmap" for trading over the balance of the year. This report is now available for $25 via credit card ordering below. Included with this report, for those subscribers who have not yet read it, we will now offer the previous analysis "Three Peaks and a Domed House" that was written January 14, 2000 (and has been working very well since then) for FREE. The two articles together offer some powerful evidence that a crash scenario is most certainly possible and perhaps closer than most realize. One may also subscribe on a quarterly basis to ALL articles past and present for just $55.
Sand Spring Advisors provides information and analysis from sources and using methods it believes reliable, but cannot accept responsibility for any trading losses that may be incurred as a result of our analysis. Individuals should consult with their broker and personal financial advisors before engaging in any trading activities, and should always trade at a position size level well within their financial condition. Principals of Sand Spring Advisors may carry positions in securities or futures discussed, but as a matter of policy will always so disclose this if it is the case, and will specifically not trade in any described security or futures for a period 5 business days prior to or subsequent to a commentary being released on a given security or futures.
Order our other article as well, and get a 20% discount on both.