
The Chart du Jour
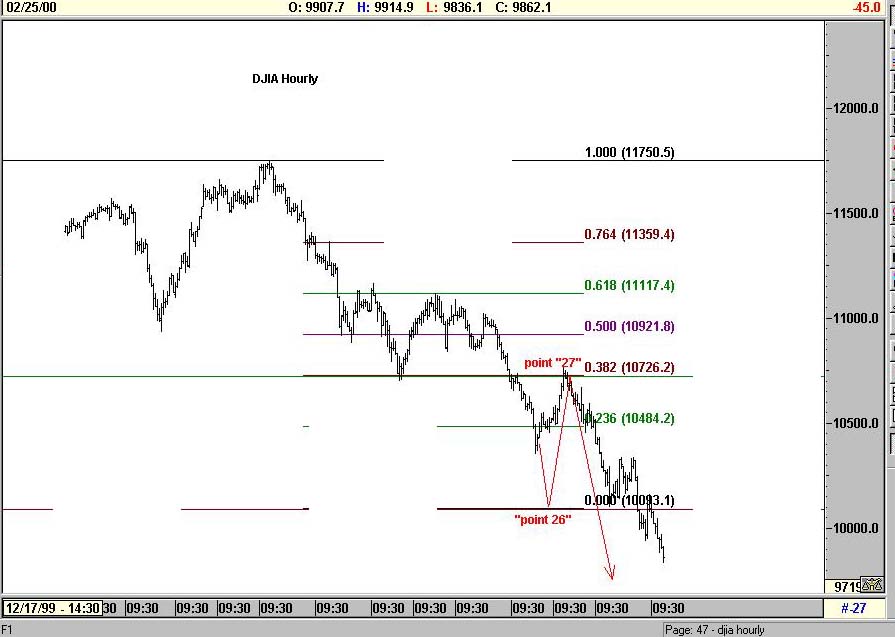
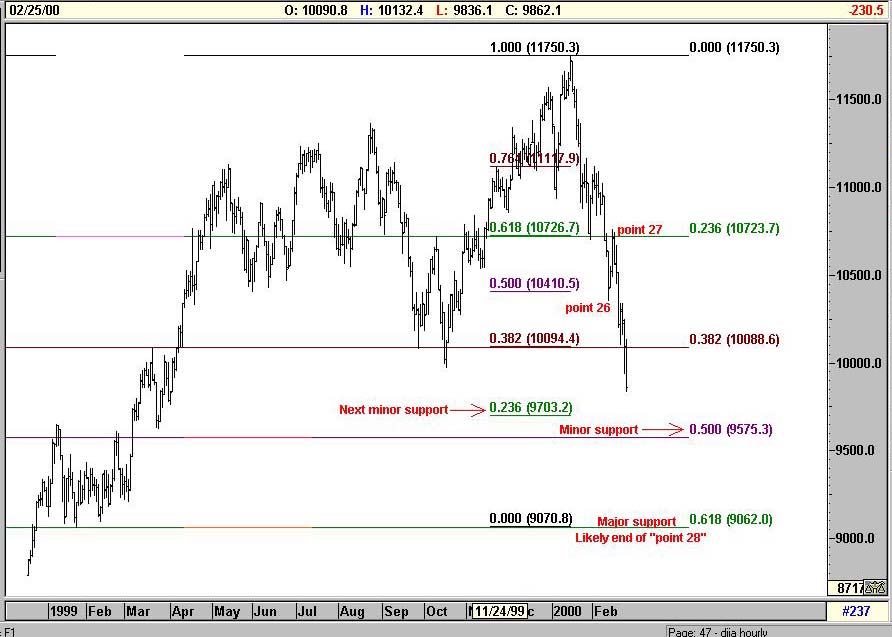
The chart above is an update of the exact hourly chart of the DJIA that we printed on these pages February 12th. In that analysis we tried to anticipate the location of Lindsay's "point 26" and "point 27" of the current DJIA decline. We missed getting point 26 correctly, but more or less nailed the level where a point 27 countertrend rally would fail. This market is now obviously headed to its point 28 locale that will likely finish a first wave down. Point 28 may come as low as 9,062 as depicted on the daily chart below, with 9703 and 9575 representing two intermediate levels of minor support along the way. The week of March 6 is a cycle date that could either represent an acceleration of the downtrend (if we were to back and fill in the near term), or more likely now, it may mark a "crash" low, with a period of consolidation to then follow until the May 4-5 cycle period. Either way, readers should be in no hurry to try to bottom pick the market right here.
For those of you confused by all this talk of point 26, point 27, and point 28, we invite you to read (now FREE for the first time) the analysis originally put up for sale on this site January 14th -- "Three Peaks and a Domed House - Revisited." It has provided an excellent roadmap for our decline to date. We are now moving toward the latter stages of this typical topping pattern originally discovered by George Lindsay in the 1960s. While the analysis presented in that article is thus quickly becoming passe, if Lindsay were alive today, he would be proud that his analysis "hit" in the year 2000 with such precision.
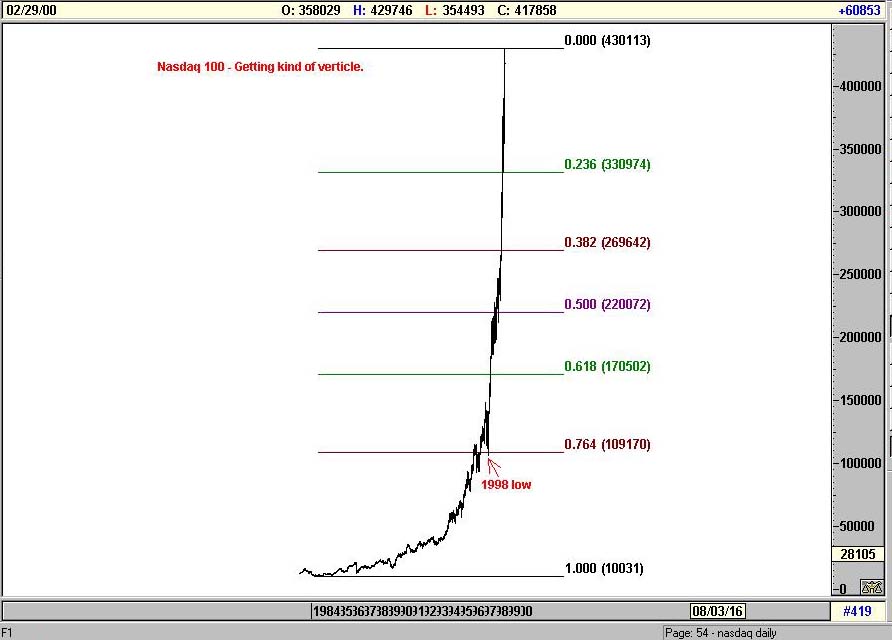
Elsewhere, of course, the ever-present relative strength of the Nasdaq has continued to leave equity bears befuddled. This is not unlike the last throws of August-September 1929 when large-cap traditional companies were already headed south while a few ever-popular darlings continued to grab the positive headlines. What is going on? This is simply stupid and greedy money arriving late to the party. The so-called "experts" have long since given up trying to disuade the public's enthusiasm to revel on, and so the experts don't. Instead they takes the funds and collect the fees that come with them. 75% of Fidelity's mutual fund assets have now succeeded in concentrating themselves into high tech. The Janus Funds are closer to 90% tech concentrated. To understand better the implications of this classic "crowded trade," please subscribe to our eight-page analysis below "Nasdaq Crash and the First Downside Stopping Point." For now, any reasonable person cannot help but see in the parabolic chart below a bubble in formation. The simple question is: how more vertical can we get? Not much, we think.
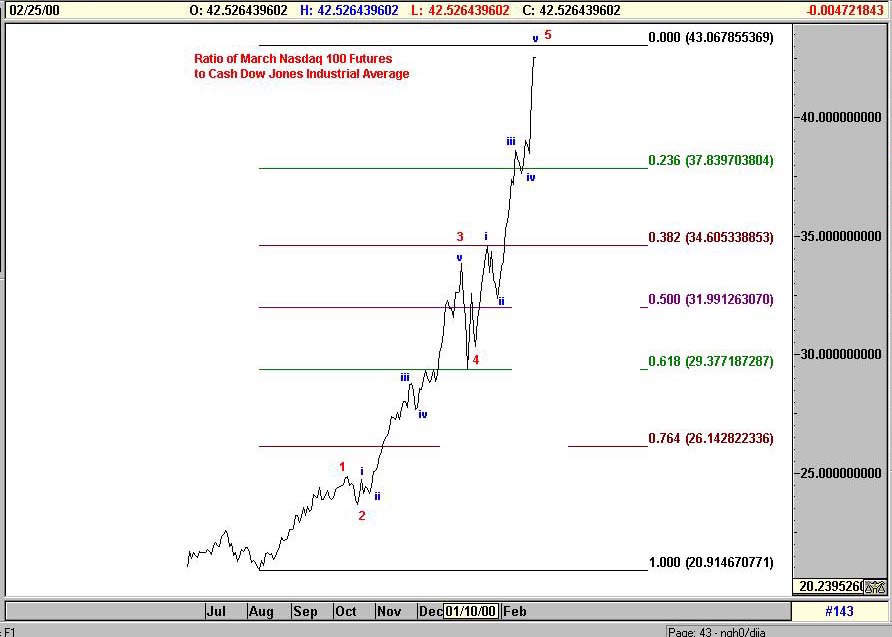
Indeed, one subscriber requested that we update the ratio chart of the Nasdaq 100 futures to the DJIA. We previously suggested that this ratio might find natural Fibonacci resistance somewhat lower than current levels, but we have now re-stretched our Fibonacci bands, and find the next "natural" level for this ratio to find significant resistance is somewhere around the Nasdaq 100 equalling 43.06% of the DJIA price. Don't bet the house on that prognostication, but keep an eye on it.
Nasdaq buyers may think themselves smart at having avoided the DJIA downdraft to date, but the general hubris of their investment tactics should only work in the short term. In the long term we may all be dead, but the Nasdaq 100 should also decline far further and far faster than anything the Dow has done to date.
How Your Articles Are Delivered
Upon the processing of your credit card or the receipt of a personal check, Sand Spring will e-mail you the articles requested as a Word attachment, and also provide you with a WWW address and password to view the article on the web without using Word should you so desire. Confirmation of your order will be immediate, and the actual article will follow by e-mail typically within a few hours and in all cases before the opening of NYSE trading on the following day.>
Ordering by Credit Card:
Our shopping cart is designed for both physical and subscription products, so do not be confused too much when it asks you for a shipping address. A correct address is important only for credit card authorization purposes. Your e-mail information is the most important piece of information to us for proper delivery of your article(s).
Sand Spring Advisors provides information and analysis from sources and using methods it believes reliable, but cannot accept responsibility for any trading losses that may be incurred as a result of our analysis. Individuals should consult with their broker and personal financial advisors before engaging in any trading activities, and should always trade at a position size level well within their financial condition. Principals of Sand Spring Advisors may carry positions in securities or futures discussed, but as a matter of policy will always so disclose this if it is the case, and will specifically not trade in any described security or futures for a period 5 business days prior to or subsequent to a commentary being released on a given security or futures.


Take me back to the Sand Spring Home Page
Comments or Problems
Thank you for visiting Sand Spring Advisors LLC, Inc. We hope to hear from you again soon. For more information on Sand Spring Advisors actual programs, services, or to request a copy of a Disclosure Document, please phone us at 973 829 1962, FAX your request to 973 829 1962, or e-mail us at information@Sandspring.com
| Corporate Office: 10 Jenks Road, Morristown, NJ 07960 Phone: 973 829 1962 Facsimile: 973 829 1962 |
Best Experienced with
The material located on this website is also the copyrighted work of Sand Spring Advisors LLC. No party may copy, distribute or prepare derivative works based on this material in any manner without the expressed permission of Sand Spring Advisors LLC
This page and all contents are Copyright © 2000 by Sand Spring Advisors, LLC, Morristown, NJ
