
The Chart du Jour
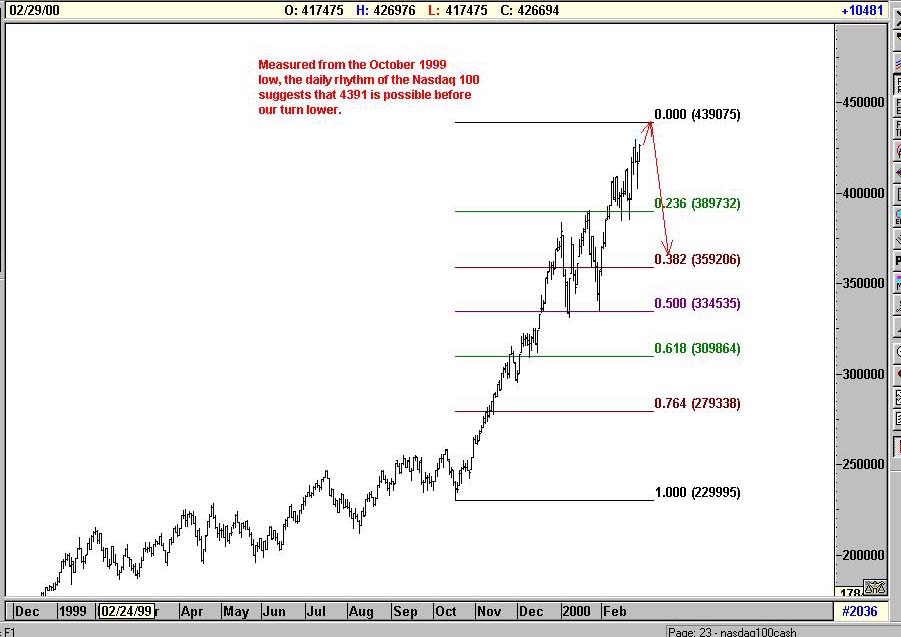
March 2-3 also marks the exact mid-point between the cycle dates we referred to back on Dec 26-27 and the next important May 4-5 cycle date. At a minimum, the character of the current equity market should mark yet another subtle shift during this window of time. Perhaps a Nasdaq peak? Perhaps the beginning of a final Nasdaq "melt-up" before a dramatic reversal lower in May? Either is certainly possible, although we still favor the former. Just how much more insane can Nasdaq valuations become? We already quite like the look of our Fibonacci retracement levels on the longer term chart of the Nasdaq 100. The "short strokes" of the Fibonacci rhythm on the daily chart now suggest that 4390 on the Nasdaq 100 is possible, but we would hasten to prognosticate that such a marginal new high would likely represent an intra-month March throwover, with the February close remaining the highest actual end-of-month close.
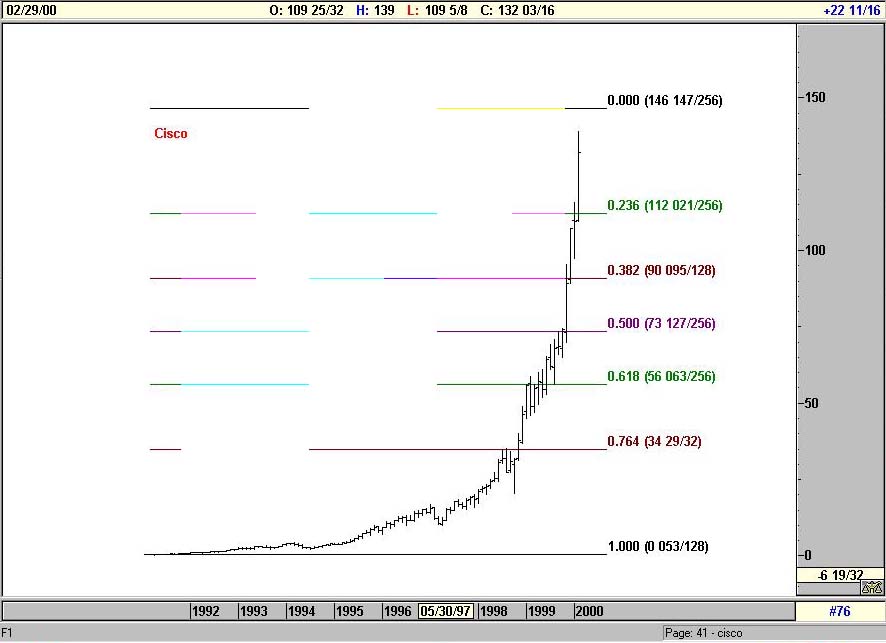
Two charts of individual equities also hold some clues for us. Cisco Systems, that ever-popular $452 billion market behemoth looks like it will be most happy with a Fibonacci extrapolated high between 146 1/2 and 147 1/2 (as previously postulated in the 2/09/00 Chart du Jour: Guideposts in the Nasdaq's Ongoing Wild Ride).
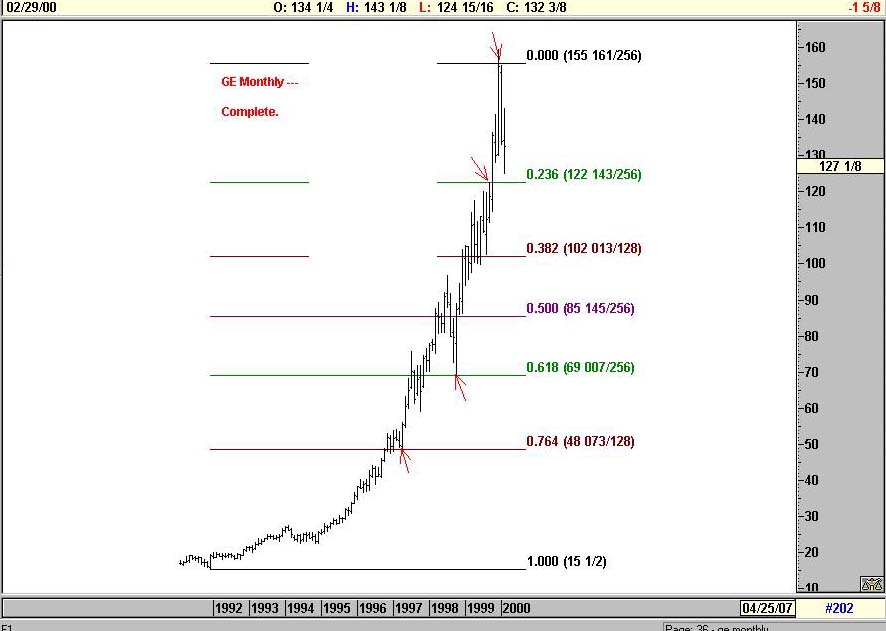
But a chart of another bellweather and market favorite, GE, already looks complete (as does Microsoft, not pictured).
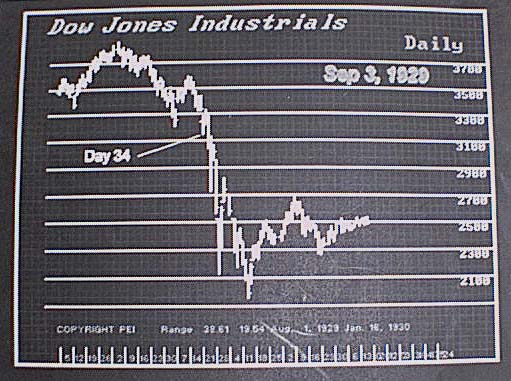
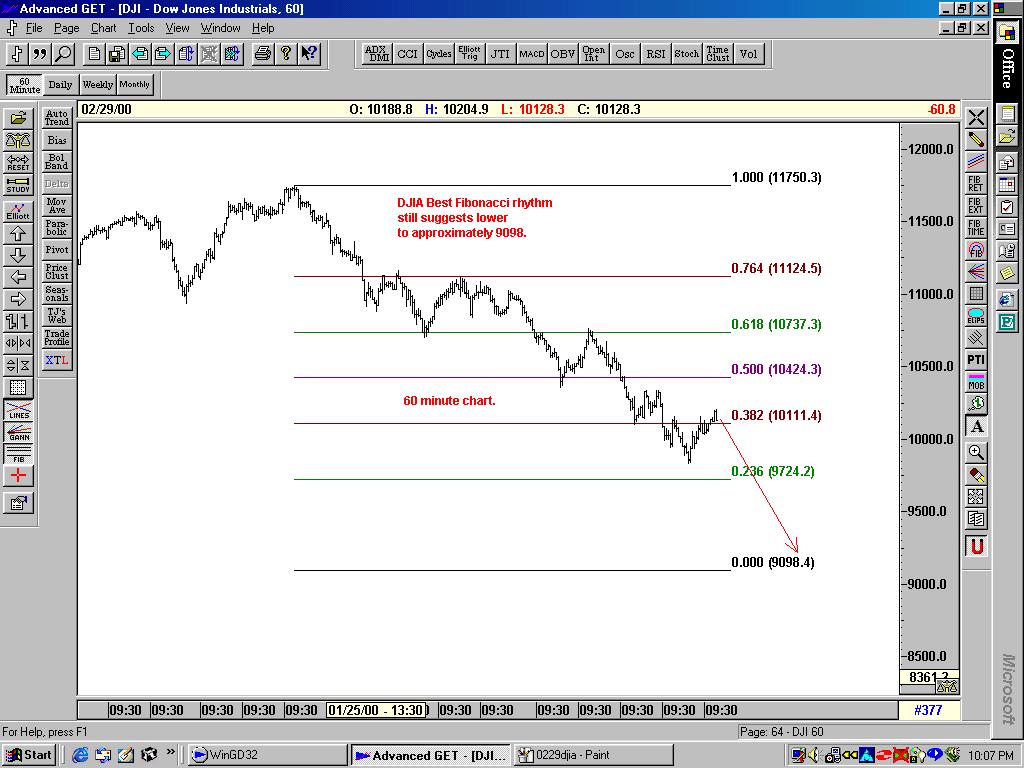
The Dow Jones Industrial Average still sports a Fibonacci rhythm that best "fits" the recent hourly chart action only toward an extrapolated low of 9098.
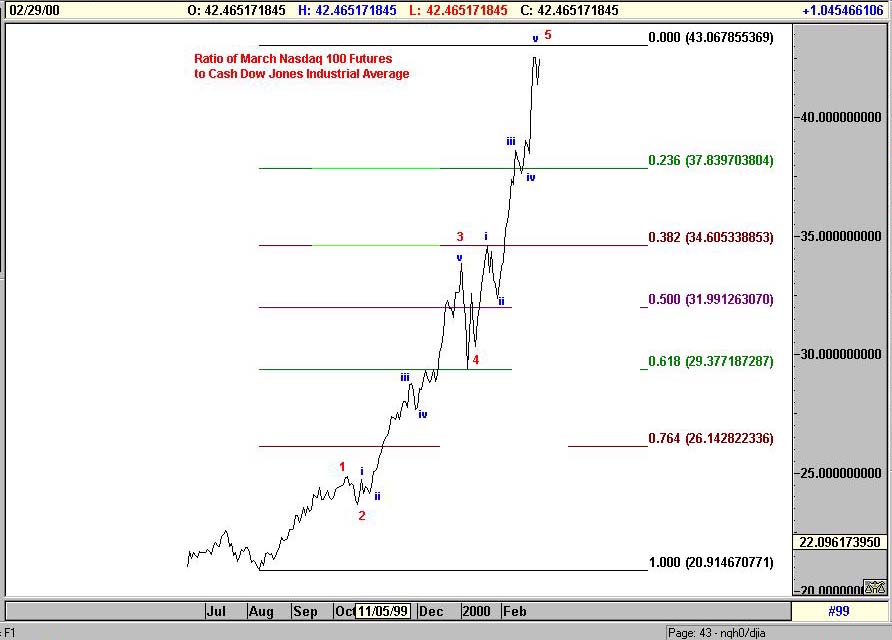
And the Nasdaq100/ DJIA ratio chart still looks poised to peak toward 43.07%
How do all the pieces of the puzzle fit? How about this: the Nasdaq spikes up to 4390 in the next day or two, with Cisco reaching 146 1/2. The DJIA stands relatively still or drops just a bit, pushing the Nasdaq100/DJIA ratio up to our 43.07% target. The end of this week then serves as the Nasdaq high, with March 6th ushering in the beginning of a dramatic Nasdaq reversal that also sends the DJIA down toward 9098 or so. This is what feels about right to us. There is enough volatility out there that we leave ourselves open to looking pretty stupid if we get any part of the above series of events wrong, but we have to call it the way we see it, and this series of events looks the most probable to us.
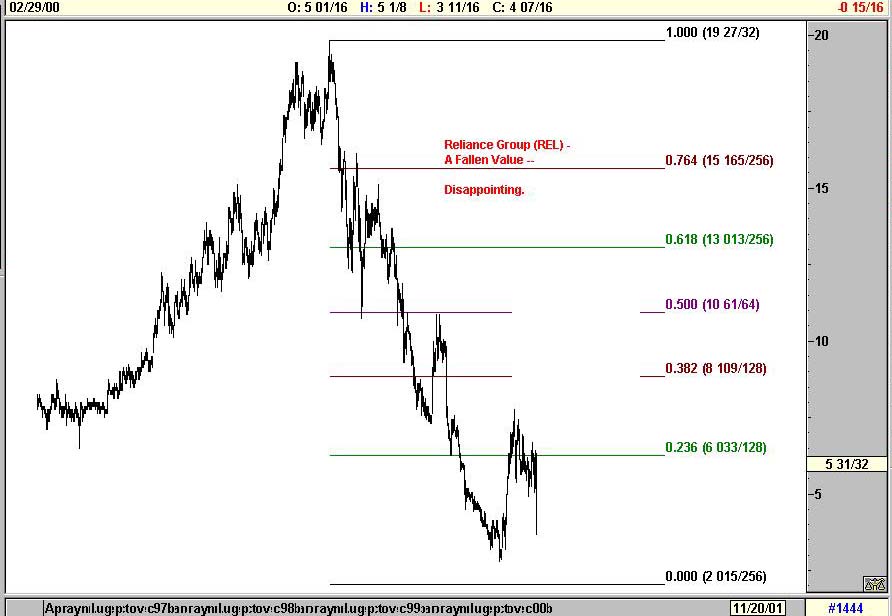
Meanwhile, for those of you who subscribed to our analysis "A Fallen Value," the drop experienced by Reliance Group Holdings Tuesday has already served to disappoint. Instead of the nice impulsive move upwards toward 9 1/2 that we had anticipated, the stock has now gone back below 4 3/8. At best, this is now a wave 2 test of the lows. At worst, what we viewed as the beginning of an impulsive reversal higher was only a wave 4, with new lows toward $2 still in the offing. The safest course of action is to exit longs and just watch this stock for awhile. The fundamental story and takeover possibility is still there, but the pattern we thought existed has been abgrogated. Dangerous and volatile times.
How Your Articles Are Delivered
Upon the processing of your credit card or the receipt of a personal check, Sand Spring will e-mail you the articles requested as a Word attachment, and also provide you with a WWW address and password to view the article on the web without using Word should you so desire. Confirmation of your order will be immediate, and the actual article will follow by e-mail typically within a few hours and in all cases before the opening of NYSE trading on the following day.>
Ordering by Credit Card:
Our shopping cart is designed for both physical and subscription products, so do not be confused too much when it asks you for a shipping address. A correct address is important only for credit card authorization purposes. Your e-mail information is the most important piece of information to us for proper delivery of your article(s).
Sand Spring Advisors provides information and analysis from sources and using methods it believes reliable, but cannot accept responsibility for any trading losses that may be incurred as a result of our analysis. Individuals should consult with their broker and personal financial advisors before engaging in any trading activities, and should always trade at a position size level well within their financial condition. Principals of Sand Spring Advisors may carry positions in securities or futures discussed, but as a matter of policy will always so disclose this if it is the case, and will specifically not trade in any described security or futures for a period 5 business days prior to or subsequent to a commentary being released on a given security or futures.


Take me back to the Sand Spring Home Page
Comments or Problems
Thank you for visiting Sand Spring Advisors LLC, Inc. We hope to hear from you again soon. For more information on Sand Spring Advisors actual programs, services, or to request a copy of a Disclosure Document, please phone us at 973 829 1962, FAX your request to 973 829 1962, or e-mail us at information@Sandspring.com
| Corporate Office: 10 Jenks Road, Morristown, NJ 07960 Phone: 973 829 1962 Facsimile: 973 829 1962 |
Best Experienced with
The material located on this website is also the copyrighted work of Sand Spring Advisors LLC. No party may copy, distribute or prepare derivative works based on this material in any manner without the expressed permission of Sand Spring Advisors LLC
This page and all contents are Copyright © 2000 by Sand Spring Advisors, LLC, Morristown, NJ
