
The Chart du Jour
The Palladium market just witnessed a parabolic advance from below $400 an ounce to above $800 in the two month period between December 1999 and February 2000 (stumbling only after draconian rule changes by the Tokyo Commodity Exchange into the March expiration cycle). During that time, gold futures languished at around $283 - barely being able to launch a rally for more than two consecutive days.
Gold did of course experience a dramatic advance from $255 to above $330 last September, catching many a speculator (let that read CTA John Henry) and over-hedged mining house (let that read Ashanti and Cambior) completely off-guard. But there has been little follow-through since.
Rumors continue to swirl that there are huge short forward and short call option positions that have yet to be covered, and rumors also circulate that there is a large undisclosed official seller of gold preventing any further advance. Neither assertion can of course be proved.
What has come to light in recent months though, is that there is a distinct bias in the way gold has been trading. Specifically, it would appear that gold has generally traded consistently lower during the North American trading day, before picking up a better bid in the Far East and the European morning.
In a study first released on website gold-eagle.com in mid-March, Harry J. Clawar, an independent Ph.D analyst of market behavior , shows that between January 25,2000 to March 17, 2000 gold traded quite regularly higher from the New York close into the London A.M. fixing (75% of the time), and then consistently lower from that time back into the New York close (70% of the time).
In order to determine if this was a statistical fluke or something more significant, he then applied what is known as a one-tailed test -- a binomial test, with a correction for continuity, to the frequency of the direction of differences. "The results indicate that the probability that the London AM fix exceeds the Previous NY close with this frequency, by chance, is less than 1 in 100," and the chance that the decline between the London A.M. fix and the New York close is a random occurrence is less than "5 times in 100."
Over the period studied, Clawar showed that the gain per ounce in London over the New York close aggregated to a positive $43.75, while the London A.M. fix to the NY close aggregated to a loss of $45.85 - ergo a generally unchanged market overall, but with a definite pattern in the market's rhythm.
"There is either a consistent and large seller in the New York time zone," states Clawar, "or there is consistent and strong accumulation of gold abroad, or most probably a bit of both. I do not know whether this represents a potential manipulation from some unnamed official source as precious metals analyst Frank Venerosa currently suggests, or simply the global market slowly accumulating gold as a replacement asset for the U.S. dollar. Either way, there is clearly something afoot here."
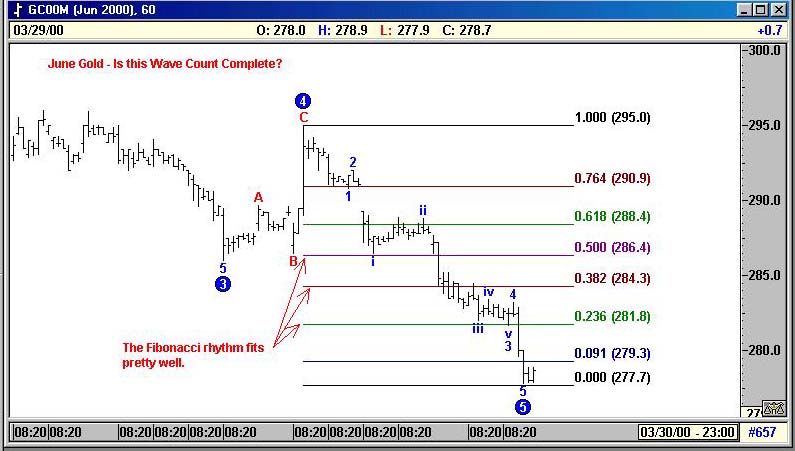
Given what the metals markets just witnessed in Palladium, perhaps short call sellers on gold bullion should take note. We would certainly expect the current push-pull between New York and the foreign markets to resolve itself in some fashion by May. We also note on the chart below an Elliott wave pattern that appears relatively complete to the downside together with a compellingly tight Fibonacci rhythm to the recent slide. We're buyers here with a tight stop a few bucks down.
Dr. Clawar may be reached at HJC@Angelfire.com
Please support Sand Spring Advisors and purchase one of our more in-depth articles below.
What our Subscription Only Articles Contain
We recently finished two in-depth articles on the equity world, one looking at some of the psychological signs of a mania entitled "A Certain Fixation," and the other focusing specifically on the Nasdaq. The former article discusses two specific equity situations, while the latter article examines the Elliott wave pattern of the Nasdaq's Price-Earnings Ratio since 1995, as well as various analog pattern matches involving the Nasdaq. "Nasdaq Crash and First Stopping Point" also looks at mutual fund cash levels, mutual fund positioning, and changes in the monetary base. It sketches out a possible path for the Nasdaq that may prove a valuable "roadmap" for trading over the balance of the year. Both articles offer some powerful evidence that a crash scenario is most certainly possible and perhaps closer than most realize. The articles are available for purchase below via credit card at $25 apiece. One may also subscribe on a quarterly basis to ALL articles past and present for just $65.
How Your Articles Are Delivered
Upon the processing of your credit card or the receipt of a personal check, Sand Spring will e-mail you the articles requested as a Word attachment, and also provide you with a WWW address and password to view the article on the web without using Word should you so desire. Confirmation of your order will be immediate, and the actual article will follow by e-mail typically within a few hours and in all cases before the opening of NYSE trading on the following day.>
Ordering by Credit Card:
Our shopping cart is designed for both physical and subscription products, so do not be confused too much when it asks you for a shipping address. A correct address is important only for credit card authorization purposes. Your e-mail information is the most important piece of information to us for proper delivery of your article(s).
Sand Spring Advisors provides information and analysis from sources and using methods it believes reliable, but cannot accept responsibility for any trading losses that may be incurred as a result of our analysis. Individuals should consult with their broker and personal financial advisors before engaging in any trading activities, and should always trade at a position size level well within their financial condition. Principals of Sand Spring Advisors may carry positions in securities or futures discussed, but as a matter of policy will always so disclose this if it is the case, and will specifically not trade in any described security or futures for a period 5 business days prior to or subsequent to a commentary being released on a given security or futures.


Take me back to the Sand Spring Home Page
Comments or Problems
Thank you for visiting Sand Spring Advisors LLC, Inc. We hope to hear from you again soon. For more information on Sand Spring Advisors actual programs, services, or to request a copy of a Disclosure Document, please phone us at 973 829 1962, FAX your request to 973 829 1962, or e-mail us at information@Sandspring.com
| Corporate Office: 10 Jenks Road, Morristown, NJ 07960 Phone: 973 829 1962 Facsimile: 973 829 1962 |
Best Experienced with
The material located on this website is also the copyrighted work of Sand Spring Advisors LLC. No party may copy, distribute or prepare derivative works based on this material in any manner without the expressed permission of Sand Spring Advisors LLC
This page and all contents are Copyright © 2000 by Sand Spring Advisors, LLC, Morristown, NJ

