
The Chart du Jour
Please don't ask why the stock market rallied today. It did something it shouldn't have done and we are honestly confused. On April 19 we suggested that the DJIA should not intersect 10,982. Now it has and then some. While there is a tremendous amount of noise and volatility around which we must formulate our views, within a bearish overall context, it may be prudent to step aside and simply watch the price action for a day or two. We remain bearish, but concerned that our anticipated roadmap is starting to diverge.
One thing that might shortly be an opportunity is some sort of countertrend bet on the euro. Previously hedge fund macro traders were bottom picking the euro. Today felt like a true stop-loss regurgitation. Yet, here we stand within a band of resistance on the dollar that we have discussed for sometime, with the specific rhythm pointing toward approximately 2.1620 basis the old USD/DEM chart as a natural stopping point. We quote below from part of an article we published last fall:
Between 1985 and 1995, the U.S. dollar fell from a high of 3.3480 DM to a low of 1.3454 DM. A "natural" minimum retracement of this decline that a trader might expect to transpire at some point would be a 38.2% retracement of the distance between those two extremes, or a move up to 2.1104. 1.618 times the 1995 low of 1.3480 equals 2.1811. The band between 2.1104 and 2.1811 thus becomes a logical minimum target zone for a rally that would fit nature's general rhythm. A full .618% retracement of the 1985-1995 decline would yield a target of 2.5830 -- a level certainly possible with time, but which would be unlikely to be reached before a tremendous amount of work between 2.1104 and 2.1811 first.
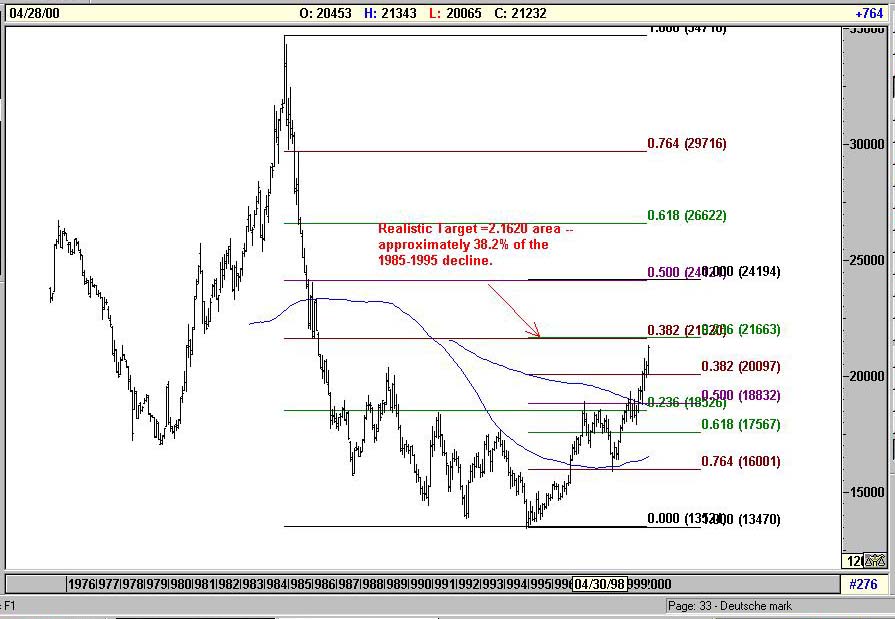
We also note that the sentiment levels on the Deutsche mark futures (let that read euro futures) have also been running quite extreme. Just 4% of respondants to Market Vane's Bullish Consensus survey are currently bullish the mark (euro). Such a level is typical of a dangerously overbought dollar. The combination of such an extreme with an important band of Fibonacci resistance means that those still astute enough to be long the dollar against Europe should say "thank you" and take their money off the table. Those who like being a contrarian should start to look at bullish DM (euro) strategies, particularly if we were to reach the upper end (2.1811) of the above mentioned band of resistance -- and particularly if we were to still be in this resistance area on our May 4th cycle date. We cannot pinpoint exactly where the dollar strength should abate between 2.1104 and 2.1811 (the 2.1620 level is our best guess loosely eye-balling the rhythm of 15 years of data), but we are sure that this range will contain a significant high. The equivalent levels basis the euro cash are .9268 and .8967.
Please support Sand Spring Advisors and purchase one of our more in-depth articles below.
How Your Articles Are Delivered
Upon the processing of your credit card or the receipt of a personal check, Sand Spring will e-mail you the articles requested as a Word attachment, and also provide you with a WWW address and password to view the article on the web without using Word should you so desire. Confirmation of your order will be immediate, and the actual article will follow by e-mail typically within a few hours and in all cases before the opening of NYSE trading on the following day.>
Ordering by Credit Card:
Our shopping cart is designed for both physical and subscription products, so do not be confused too much when it asks you for a shipping address. A correct address is important only for credit card authorization purposes. Your e-mail information is the most important piece of information to us for proper delivery of your article(s).
Sand Spring Advisors provides information and analysis from sources and using methods it believes reliable, but cannot accept responsibility for any trading losses that may be incurred as a result of our analysis. Individuals should consult with their broker and personal financial advisors before engaging in any trading activities, and should always trade at a position size level well within their financial condition. Principals of Sand Spring Advisors may carry positions in securities or futures discussed, but as a matter of policy will always so disclose this if it is the case, and will specifically not trade in any described security or futures for a period 5 business days prior to or subsequent to a commentary being released on a given security or futures.


Take me back to the Sand Spring Home Page
Comments or Problems
Thank you for visiting Sand Spring Advisors LLC, Inc. We hope to hear from you again soon. For more information on Sand Spring Advisors actual programs, services, or to request a copy of a Disclosure Document, please phone us at 973 829 1962, FAX your request to 973 829 1962, or e-mail us at information@Sandspring.com
| Corporate Office: 10 Jenks Road, Morristown, NJ 07960 Phone: 973 829 1962 Facsimile: 973 829 1962 |
Best Experienced with
The material located on this website is also the copyrighted work of Sand Spring Advisors LLC. No party may copy, distribute or prepare derivative works based on this material in any manner without the expressed permission of Sand Spring Advisors LLC
This page and all contents are Copyright © 2000 by Sand Spring Advisors, LLC, Morristown, NJ

