
The Chart du Jour
The Nasdaq 100 on an intraday basis reached 2975 Wednesday -- just above our first targeted support at 2970. Although we would ideally like to see a close toward the lows for the month of May with a reversal higher the week of June 5th, we have to admit that we are starting to turn somewhat skeptical as to whether our secondary target of 2522 per the Chart du Jour of May 21st can be reached. For those psychologically anxious to book profits on shorts, it is probably fine to do so here. For those still greedy for more downside profits, we may get one more spike down to 2740 at some point, but we would certainly exit short positions there.
Broadly speaking, our analysis of late February entitled "Nasdaq Crash and First Downside Stopping Point" has now been fulfilled. It is simply that we went a bit higher than we expected in early March, and hence we may be stopping a bit higher than we originally extrapolated basis Fibonacci retracement methods.
Three things are starting to suggest that a signficant bounce is coming -- not a bull market mind you, just a bounce. The first of these is that bullish sentiment levels have now collapsed down to just 25% per recent calculations by Pasadena-based Market Vane Inc. This is almost the lowest sentiment reading that we have seen in the last twelve months.
Second, by having dropped to new lows the last few days, we not only reached our first Fibonacci level of support, but we have also completed the minimum requirements of a 5-wave down structure on the Nasdaq 100 since the March 24th high. Ideally, we would not be surprised to see some sort of downward wedge pattern develop into the week of June 5th that may take us to 2740, but this is certainly not required. It would just be our highest probability expectation.
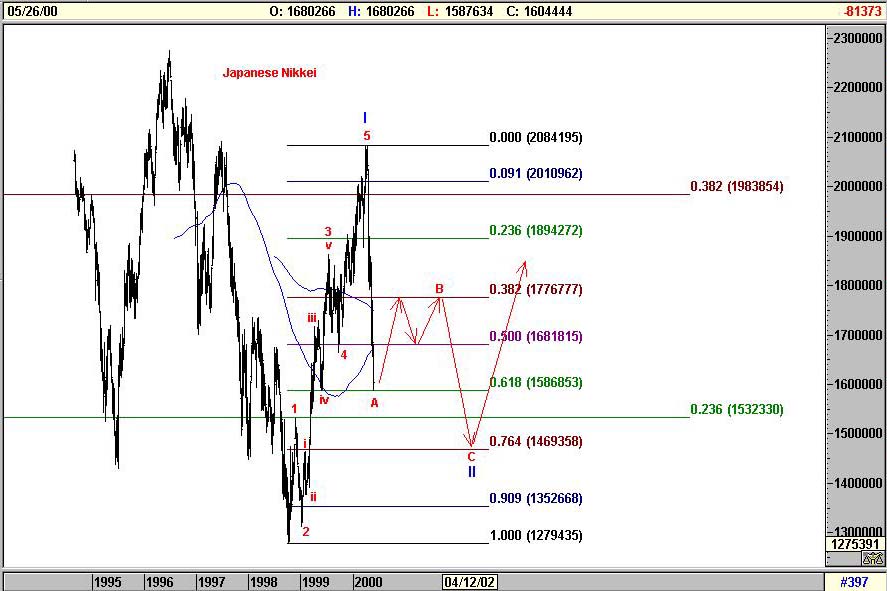
Third, take a look at the Japanese Nikkei chart below. After making what appears to have been a nice 5-wave ascent earlier this year, Japan has basically suffered an Alcapulco-cliff dive pattern bang to a level that represents a 61.8% retracement of its entire prior upmove. If you want to make a longer-term bullish case for Japan slowly turning the corner, this recent move most probably represents an A-wave of an eventual A-B-C 2 Wave retracement. A still bearish fundamental analyst might argue instead that the recent move represents a 1 of the V Wave down. Either way, a substantive bounce for the Nikkei is likely in the short term.
We do not turn even neutral U.S. equities easily, nor do we think longer term, the bear market is anywhere close to being over. We also recognize that the Nasdaq 100 has now fallen below and stayed below its 200-day moving average these past few days -- a welcome sign for any bearish analyst. We just don't think the risk/reward of playing the short side of this market is that attractive for the moment. Equities will likely back and fill for a good chunk of the early summer bounded by 2740 on the downside and 3770 on the topside basis the Nasdaq 100. This is the range that we would now look to counter trade if and when given the opportunity. Wednesday's close at 3180 truly represents approximate fair value for this market over the intermediate term.
Please support Sand Spring Advisors and purchase one of our more in-depth articles below.
How Your Articles Are Delivered
Upon the processing of your credit card or the receipt of a personal check, Sand Spring will e-mail you the articles requested as a Word attachment, and also provide you with a WWW address and password to view the article on the web without using Word should you so desire. Confirmation of your order will be immediate, and the actual article will follow by e-mail typically within a few hours and in all cases before the opening of NYSE trading on the following day.>
Ordering by Credit Card:
Our shopping cart is designed for both physical and subscription products, so do not be confused too much when it asks you for a shipping address. A correct address is important only for credit card authorization purposes. Your e-mail information is the most important piece of information to us for proper delivery of your article(s).
Sand Spring Advisors provides information and analysis from sources and using methods it believes reliable, but cannot accept responsibility for any trading losses that may be incurred as a result of our analysis. Individuals should consult with their broker and personal financial advisors before engaging in any trading activities, and should always trade at a position size level well within their financial condition. Principals of Sand Spring Advisors may carry positions in securities or futures discussed, but as a matter of policy will always so disclose this if it is the case, and will specifically not trade in any described security or futures for a period 5 business days prior to or subsequent to a commentary being released on a given security or futures.


Take me back to the Sand Spring Home Page
Comments or Problems
Thank you for visiting Sand Spring Advisors LLC, Inc. We hope to hear from you again soon. For more information on Sand Spring Advisors actual programs, services, or to request a copy of a Disclosure Document, please phone us at 973 829 1962, FAX your request to 973 829 1962, or e-mail us at information@Sandspring.com
| Corporate Office: 10 Jenks Road, Morristown, NJ 07960 Phone: 973 829 1962 Facsimile: 973 829 1962 |
Best Experienced with
The material located on this website is also the copyrighted work of Sand Spring Advisors LLC. No party may copy, distribute or prepare derivative works based on this material in any manner without the expressed permission of Sand Spring Advisors LLC
This page and all contents are Copyright © 2000 by Sand Spring Advisors, LLC, Morristown, NJ

