
The Chart du Jour
A few years ago, every fund manager was bullish on the Australian dollar. They couldn't get enough of it. Unfortunately, they were paying the wrong price -- above U.S. .80 cents to buy it. Now, however, the Australian dollar is largely scorned -- even though it recently fell to a new all-time low, and has recently started to act a bit better technically.
Occasionally, when we view a chart pattern, it reminds us of another chart pattern, and so it is with the current look and feel of the long-term chart of the Australian dollar pictured on the right below. To us, this chart pattern looks ever so similar to the way the Nikkei looked a few years ago on its way to a solid bounce into mid-22,000s -- albeit not having yet formed its definitive bottom.
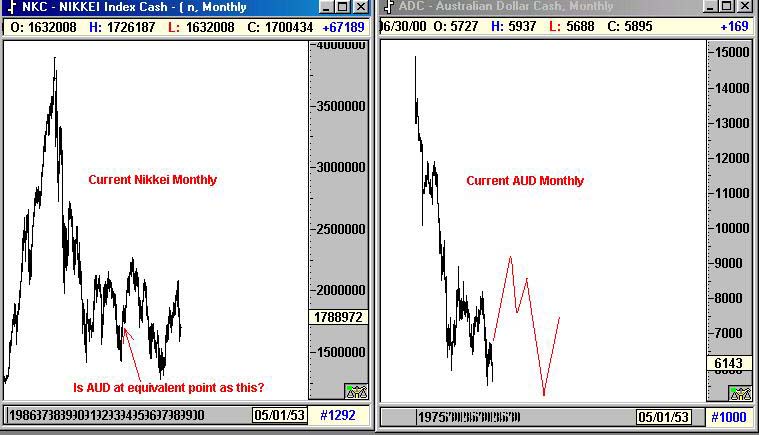
If the Australian dollar were to now follow a similar path, a dramatic blast-off now could still be followed by new lows down the road. This would be consistent with our current view of the gold market (often closely correlated to the Australian dollar) that calls for a typical late-cycle rally in that metal now, but a more important and lasting low next year (Subscribe to "Cyclical Commodity Turns" for more details).
Please support Sand Spring Advisors and purchase one of our more in-depth articles below.
How Your Articles Are Delivered
Upon the processing of your credit card or the receipt of a personal check, Sand Spring will e-mail you the articles requested as a Word attachment, and also provide you with a WWW address and password to view the article on the web without using Word should you so desire. Confirmation of your order will be immediate, and the actual article will follow by e-mail typically within a few hours and in all cases before the opening of NYSE trading on the following day.>
Ordering by Credit Card:
Our shopping cart is designed for both physical and subscription products, so do not be confused too much when it asks you for a shipping address. A correct address is important only for credit card authorization purposes. Your e-mail information is the most important piece of information to us for proper delivery of your article(s).
Sand Spring Advisors provides information and analysis from sources and using methods it believes reliable, but cannot accept responsibility for any trading losses that may be incurred as a result of our analysis. Individuals should consult with their broker and personal financial advisors before engaging in any trading activities, and should always trade at a position size level well within their financial condition. Principals of Sand Spring Advisors may carry positions in securities or futures discussed, but as a matter of policy will always so disclose this if it is the case, and will specifically not trade in any described security or futures for a period 5 business days prior to or subsequent to a commentary being released on a given security or futures.
If you order by credit card, your credit card will be billed as "Sand Spring Advisors LLC"


Take me back to the Sand Spring Home Page
Comments or Problems
Thank you for visiting Sand Spring Advisors LLC, Inc. We hope to hear from you again soon. For more information on Sand Spring Advisors actual programs, services, or to request a copy of a Disclosure Document, please phone us at 973 829 1962, FAX your request to 973 829 1962, or e-mail us at information@Sandspring.com
| Corporate Office: 10 Jenks Road, Morristown, NJ 07960 Phone: 973 829 1962 Facsimile: 973 829 1962 |
Best Experienced with
The material located on this website is also the copyrighted work of Sand Spring Advisors LLC. No party may copy, distribute or prepare derivative works based on this material in any manner without the expressed permission of Sand Spring Advisors LLC
This page and all contents are Copyright © 2000 by Sand Spring Advisors, LLC, Morristown, NJ

