
The Chart du Jour
Despite a rather hefty slide in the oil price today, gold punched signficantly higher. The CRB fell. It appears as if our ruminations of June 24th. were reasonably astute, at least for the moment. Now we just need wheat to perk up even in the face of a falling CRB, and our technical visions will be truly fulfilled.
s there a macro "thred" behind all these disparate movements? We think not. In the case of oil, it's just an over-bought market coming undone (bullish sentiment numbers having been above 94% bullish for quite some while). In the case of gold, it may just be its normal seasonal tendencies starting to show through.
You see, it seems that gold almost always rallies at this time of year between the last week of June and onwards until Labor Day. If you took the average performance for this metal during these months over the past twenty years and added them all together, you would net see a net gain despite this market's overall trend lower.
Why, you might ask should this be the case? It turns out in the real world that Christmas comes early to the gold market. Jewelry manufacturers start to enter the market in late June as buyers in order to have sufficient gold inventory to fabricate their products by the Christmas selling season. If they buy any earlier, they unnecessarily tie up their capital too soon in a non-interest bearing asset with some price exposure. If they buy too much later, they cannot guarantee having sufficient product fabricated in time for the fall selling season. If that sounds overly simplistic, perhaps too simple, fair enough -- there are always a host of economic events transpiring in the world, and gold demand for jewelry production is just one of them. Nonetheless, it does tend to have a nice underpinning effect and produce a natural positive bias to the price, other factors being equal.
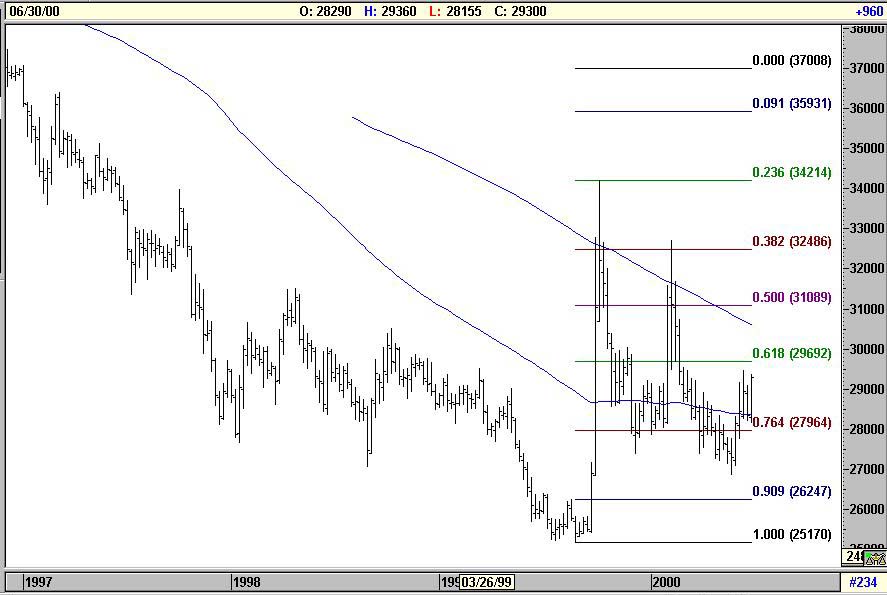
The Chart below is of the cash gold price. At this point, the next area of resistance is the 200-day moving average up at $306. If we can clear that level successfully, the underlying Fibonacci rhythm of this chart suggests $370 as a likely target. Readers of these pages will remember our first suggestion to buy gold near $273 with a $268 stop. We then raised our stop to our entry point, and will now raise it again to just under Wednesday's low at $281.55. This guarantees us approximately an $8 profit (minus any skid on such a stop's election), while we will let our profits run. For those so inclined, $306 would be a natural level to scalp a few short term profits, but overall, this chart and the chart of mining house Anglogold look quite nicely poised.
Please support Sand Spring Advisors and purchase one of our more in-depth articles below.
How Your Articles Are Delivered
Upon the processing of your credit card or the receipt of a personal check, Sand Spring will e-mail you the articles requested as a Word attachment, and also provide you with a WWW address and password to view the article on the web without using Word should you so desire. Confirmation of your order will be immediate, and the actual article will follow by e-mail typically within a few hours and in all cases before the opening of NYSE trading on the following day.>
Ordering by Credit Card:
Our shopping cart is designed for both physical and subscription products, so do not be confused too much when it asks you for a shipping address. A correct address is important only for credit card authorization purposes. Your e-mail information is the most important piece of information to us for proper delivery of your article(s).
Sand Spring Advisors provides information and analysis from sources and using methods it believes reliable, but cannot accept responsibility for any trading losses that may be incurred as a result of our analysis. Individuals should consult with their broker and personal financial advisors before engaging in any trading activities, and should always trade at a position size level well within their financial condition. Principals of Sand Spring Advisors may carry positions in securities or futures discussed, but as a matter of policy will always so disclose this if it is the case, and will specifically not trade in any described security or futures for a period 5 business days prior to or subsequent to a commentary being released on a given security or futures.
If you order by credit card, your credit card will be billed as "Sand Spring Advisors LLC"


Take me back to the Sand Spring Home Page
Comments or Problems
Thank you for visiting Sand Spring Advisors LLC, Inc. We hope to hear from you again soon. For more information on Sand Spring Advisors actual programs, services, or to request a copy of a Disclosure Document, please phone us at 973 829 1962, FAX your request to 973 829 1962, or e-mail us at information@Sandspring.com
| Corporate Office: 10 Jenks Road, Morristown, NJ 07960 Phone: 973 829 1962 Facsimile: 973 829 1962 |
Best Experienced with
The material located on this website is also the copyrighted work of Sand Spring Advisors LLC. No party may copy, distribute or prepare derivative works based on this material in any manner without the expressed permission of Sand Spring Advisors LLC
This page and all contents are Copyright © 2000 by Sand Spring Advisors, LLC, Morristown, NJ

