
The Chart du Jour
As the Nasdaq vaulted higher in February and early March, we spent considerable amount of time looking at the Nasdaq/Dow Jones ratio trying to anticipate its reversal. As we continue to await the resolution of the 4-month coil on the Value Line Index to help us set a more definitive tone for the equity market in the near future, we thought it worth a moment to update how this other ratio chart currently appears.
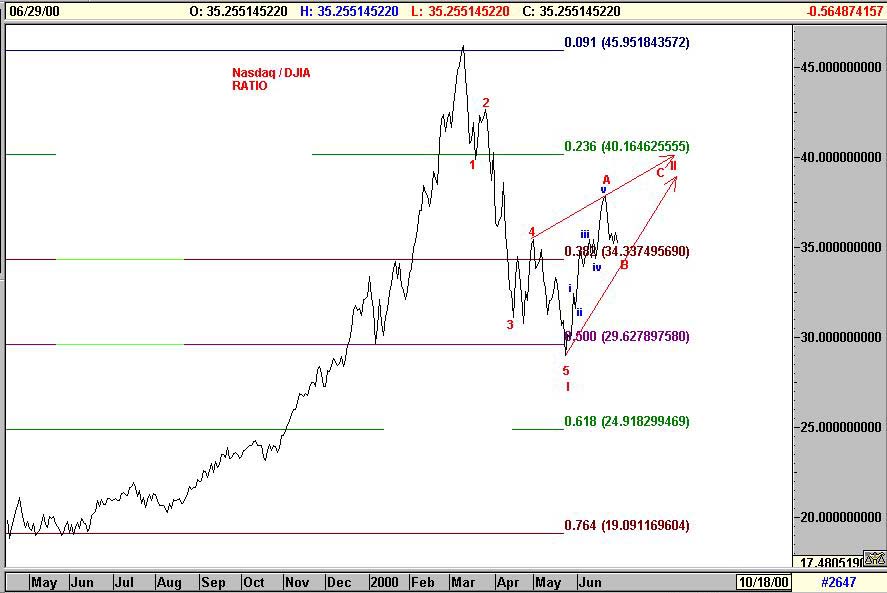
There is little doubt in our mind that the decline in this ratio between early March and late May took an Elliott wave 5-wave form. From a definitional point of view therefore, if this recent decline is just a correction within a longer term uptrend (the popular view), it cannot in and of itself be a completed correction --- which must transpire in a bigger a-b-c or a-b-c-d-e fashion, not in an impulsive move. Under this interpretation, our recent decline is just the first A leg of a bigger A-B-C pattern. More work needs to be done, and after further grinding work is done to complete a B wave up (itself an a-b-c pattern), the C-wave will eventually take us to another new low.
If instead, this Mar-May decline was the beginning of a new bear market, marking a Wave I down, then the minor minuette rally that has ensued since late May also transpired in a 5-wave up fashion, meaning that it too cannot be a completed Wave 2 bounce. Once again, it can only be viewed instead as just the first part of a more complex a-b-c II wave bounce.
The bottom line is that in either scenario, this will likely continue to be a choppy trader's market for a bit longer before we can definitively expect a new impulsive move for this ratio. Our preferred interpretation is labeled on the chart: that we have likely finished the a-wave bounce back on June 21st at 37.81%. We are currently in a b-wave down which after it runs its course, should lead to a c up. This c-wave would ideally terminate back around 39.55%, but could extend even higher. However, The March 10th high just above 45.95% should not be abrogated. This entire formation is likely to look like an upward sloping wedge and will represent either a II wave or bigger B-wave. Once this wedge pattern is complete, the market will then be far more set up to take a real dump than it is right now.
All of this would allow of course for the Value Line Index and the NYA Index (as discussed in previous Chart du Jours) to have one final burst higher (the latter to new highs) before all these markets come undone in a far more massive flush down.
This weekend is a partial solar eclipse that in the past has sometimes marked political/financial turmoil in the world, and we have another eclipse July 16. The markets are unlikely to be tame throughout this period, but short term swings notwithstanding, the Nasdaq/Dow ratio looks likely to remain stuck in a choppy range with a mild upward bias for sometime to come.
Please support Sand Spring Advisors and purchase one of our more in-depth articles below.
How Your Articles Are Delivered
Upon the processing of your credit card or the receipt of a personal check, Sand Spring will e-mail you the articles requested as a Word attachment, and also provide you with a WWW address and password to view the article on the web without using Word should you so desire. Confirmation of your order will be immediate, and the actual article will follow by e-mail typically within a few hours and in all cases before the opening of NYSE trading on the following day.>
Ordering by Credit Card:
Our shopping cart is designed for both physical and subscription products, so do not be confused too much when it asks you for a shipping address. A correct address is important only for credit card authorization purposes. Your e-mail information is the most important piece of information to us for proper delivery of your article(s).
Sand Spring Advisors provides information and analysis from sources and using methods it believes reliable, but cannot accept responsibility for any trading losses that may be incurred as a result of our analysis. Individuals should consult with their broker and personal financial advisors before engaging in any trading activities, and should always trade at a position size level well within their financial condition. Principals of Sand Spring Advisors may carry positions in securities or futures discussed, but as a matter of policy will always so disclose this if it is the case, and will specifically not trade in any described security or futures for a period 5 business days prior to or subsequent to a commentary being released on a given security or futures.
If you order by credit card, your credit card will be billed as "Sand Spring Advisors LLC"


Take me back to the Sand Spring Home Page
Comments or Problems
Thank you for visiting Sand Spring Advisors LLC, Inc. We hope to hear from you again soon. For more information on Sand Spring Advisors actual programs, services, or to request a copy of a Disclosure Document, please phone us at 973 829 1962, FAX your request to 973 829 1962, or e-mail us at information@Sandspring.com
| Corporate Office: 10 Jenks Road, Morristown, NJ 07960 Phone: 973 829 1962 Facsimile: 973 829 1962 |
Best Experienced with
The material located on this website is also the copyrighted work of Sand Spring Advisors LLC. No party may copy, distribute or prepare derivative works based on this material in any manner without the expressed permission of Sand Spring Advisors LLC
This page and all contents are Copyright © 2000 by Sand Spring Advisors, LLC, Morristown, NJ

