
The Chart du Jour
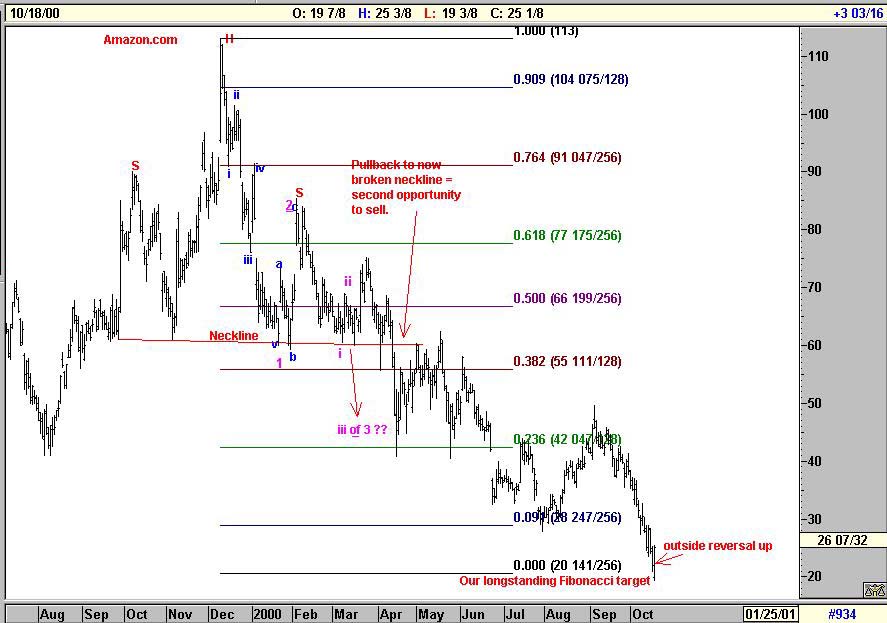
Amazon reached our longstanding Fibonacci target of $20 today (see Chart du Jour of April 19, 2000), and then promptly left an "outside reversal up" chart pattern. This pattern is defined as a stock making new lows for a move, followed by a closing price above the prior day's high. Now don't get us wrong: There is likely no real hurry to buy this or most other stocks, but after a period of equity devastation, perhaps this is the first leading sign that we are overdue for a pause...a bounce..a trading range -- at least in this particular security.
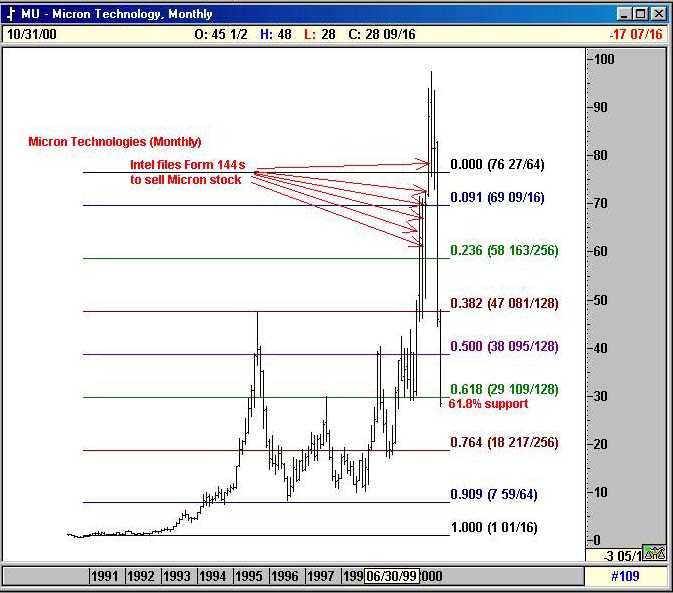
After all -- although few in the popular media seem to be focusing on it -- we have just experienced a crash in given equities far greater than any damage done back in 1987. Just look at the chart below of Micron Technology. Never has so much wealth been created and destroyed in so short a period of time as perhaps has been the case in Micron's price behavior. Note all the insider selling by Intel of Micron toward the highs as well. We previously detailed this in our June 2000 article "When Insiders Rule." This chart simply represents an update of the chart we showed back then.
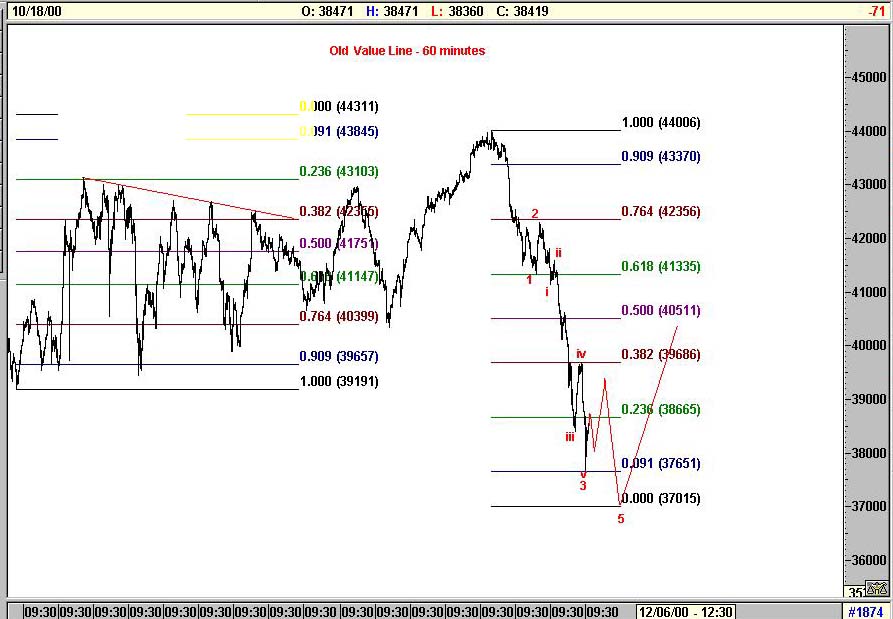
So we have the sense that a short period of gestation (a few days perhaps) is now due, although beyond a few days, we still fear that the Dow Jones Industrials in particular will have one final slide to new lows in late October. This general view is confirmed when we look at another index -- the old Value Line Index (a favorite of ours, if few others) -- where there is a relatively clear look and feel of a wave 3 low on the sixty minute chart. A sloppy wave 4 bounce would then likely be followed by a final thrust lower in this index later this month.
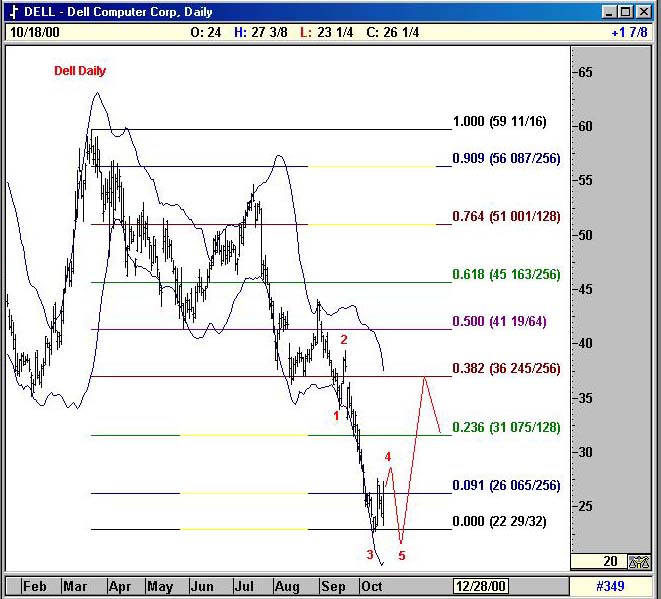
So overall, is it time to buy? Not yet. Is it time to start scaling out of selected short positions? Most likely. From the $20-$22 region in Dell for example, we could see Dell eventually regaining $36 in a short term rush -- maybe to celebrate another son of Texas gaining the White House in November. Such a gain would not likely be sustainable for long, but it is lurking out there a few weeks away.
More precise detail of our specific date prognostications for a tradable market low using Fibonacci techniques can be found by subscribers in our Oct 5th. intermediate term analysis.
For immediate web-based access to our latest subscriber-only analysis, please support Sand Spring Advisors and purchase a quarterly subscription below. Our latest work will be accessible on the final page of the order process. A user-id and password for web access to all past and future articles will follow by e-mail.
How Your Articles Are Delivered
Upon the processing of your credit card or the receipt of a personal check, Sand Spring will e-mail you the articles requested as a Word attachment, and also provide you with a WWW address and password to view the article on the web without using Word should you so desire. Confirmation of your order will be immediate, and the actual article will follow by e-mail typically within a few hours and in all cases before the opening of NYSE trading on the following day.
Ordering by Credit Card:
Our shopping cart is designed for both physical and subscription products, so do not be confused too much when it asks you for a shipping address. A correct address is important only for credit card authorization purposes. Your e-mail information is the most important piece of information to us for proper delivery of your article(s).
Sand Spring Advisors provides information and analysis from sources and using methods it believes reliable, but cannot accept responsibility for any trading losses that may be incurred as a result of our analysis. Individuals should consult with their broker and personal financial advisors before engaging in any trading activities, and should always trade at a position size level well within their financial condition. Principals of Sand Spring Advisors may carry positions in securities or futures discussed, but as a matter of policy will always so disclose this if it is the case, and will specifically not trade in any described security or futures for a period 5 business days prior to or subsequent to a commentary being released on a given security or futures.
If you order by credit card, your credit card will be billed as "Sand Spring Advisors LLC"


Take me back to the Sand Spring Home Page
Comments or Problems
Thank you for visiting Sand Spring Advisors LLC, Inc. We hope to hear from you again soon. For more information on Sand Spring Advisors actual programs, services, or to request a copy of a Disclosure Document, please phone us at 973 829 1962, FAX your request to 973 829 1962, or e-mail us at information@Sandspring.com
| Corporate Office: 10 Jenks Road, Morristown, NJ 07960 Phone: 973 829 1962 Facsimile: 973 829 1962 |
Best Experienced with
The material located on this website is also the copyrighted work of Sand Spring Advisors LLC. No party may copy, distribute or prepare derivative works based on this material in any manner without the expressed permission of Sand Spring Advisors LLC
This page and all contents are Copyright © 2000 by Sand Spring Advisors, LLC, Morristown, NJ

