
Sand Spring Advisors LLC
Testing History and Adjusting the Fractals
December 24, 2001
by, Barclay T. Leib
Source: Bloomberg Inc./Scudder Investments
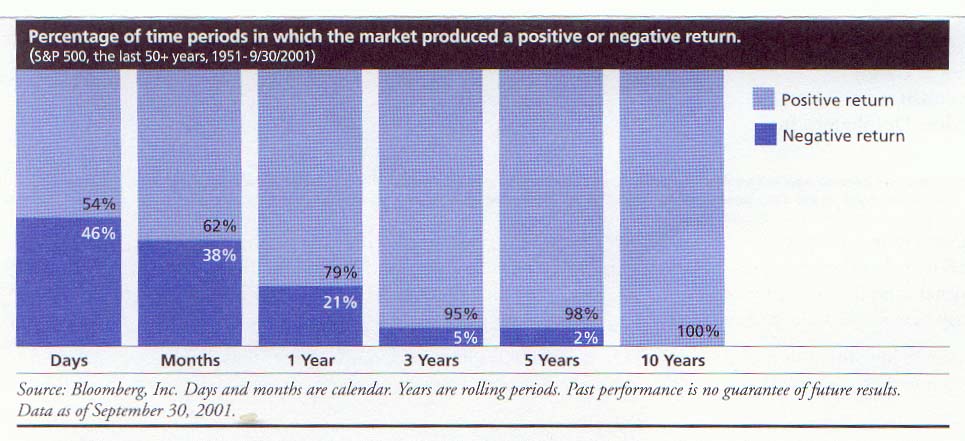
The chart above recently arrived in my mailbox from Scudder Investments (where I keep no more than a money market checking account). It was accompanied by some upbeat text that read:
"We encourage you to consider the market's longer-term history. An investor who put $1,000 into the S&P 500 would have experienced 10 declines of 15 percent or more during the past fifty-plus years. By selling after any of these declines, an investor would have locked in a loss and not participated in any subsequent upside to the market. However, the investor who held on would have seen the value of his or her $1,000 increase to over $320,000 -- and that includes the market decline of the past two years."At this point the letter refers specifically to the above chart.
"The left-hand column indicates that on any single day during the past 50 years, the stock market (as measured by the S&P 500 Index) rose only 54 percent of the time. But the longer an investor held on, the higher the rate of "success" as measured by a positive return. In fact, in every one of the 41 rolling ten-year intervals measured during the past fifty years, the market produced a positive return."Well, on this front, and now two years into a devastating bear market that has seen the NASDAQ Composite shed over 62% of its value, and the S&P 500 lose over 26% of its value, I think it's pretty clear (despite the Scudder attempt to be upbeat) that we are about to start "testing history." Specifically, the percentage of times that the market has failed to offer a positive return over at least three years and possibly over the five year interval should start to rise.
We say this not only because Scudder's "history" conveniently misses over two decades of great market pain between 1929-1949, but because of possible Fibonacci fractal reasons as well.
You see, even if we assume Scudder's 54% up/ 46% down split in days to be a reasonable observance over long periods of time, and even if we more generously allow for the market to be up 62% of months, and down 38% of months over long periods as well (in a beautiful Fibonacci proportion no less!), we think the fractal proportions in the three year column look out of whack. In lieu of 79% up and 21% down over 1-year time-horizons, any fan of Fibonacci fractal proportions would expect this to perhaps become a more natural 76.4% up and 23.6% down. Similarly in the five-year column, we think 95% up and 5% down is likely headed to a 90.98% up and 9.015% down. The percentages in red are of course Fibonacci proportions that occur throughout nature and that we draw on our charts all the time (23.6%=.618 x .382; and 76.4% = 1- .236; and 9.015% = .382 x .236).
So just when Scudder trots out its stats to support the bull case, those stats look likely to change. Just perhaps, perhaps, these ratios will do so in a way that also harmonizes with our Fibonacci proportions. Or, more likely, these stats are already harmonized, and Scudder's sample period is just too short.
Americans love their statistics like no other nation in the world. In baseball, diligent fans pour over daily newspapers filled with batting averages, RBIs, strike-outs, and home runs. In hockey, fans examine shots on goal, number of assists, and penalty minutes, among other minutia. In football, a whole list of other individual and team stats come with each game. And of course, we love our stats in the stock market as well. More than most global investment communities, we pour over P/E ratios, Price-to-Book ratios, Price-to-Sales ratios, Debt-to-Equity ratios, Inventory-to-Sales ratios, Receivables-to-Sales ratios, etc. in an effort to make informed and educated decisions on our investments.
All that is fine. But just don't be too easily fooled by silly statistics like this Positive-Negative Return Table.
Here's a short baseball analogy. Three years ago Jay Buehner of the Seattle Mariners was hitting a robust .345. Despite his mounting age, Buehner had been a power hitter for the Mariners for years, and appeared well on the path to extending his baseball career for multiple more years. Last year, Buehner got injured early in the season, and when he finally came back in late August, he could barely make it above a .200 batting average. This year he is retiring. Stats change. The world changes.
Scudder should be ashamed to send its customers pablum such as this in an effort to keep them from "throwing in the cards" on past speculations gone awry. "Stats" such as this only serve to feed the natural tendency of man to be a wishful thinker. Don't expect Scudder's table to actually hold up in its current status much longer.
Non-subscribers are invited to sign up for a quarterly subscription below. Sand Spring's latest thoughts will all be accessible via an immediate e-mail. A permanent user-id and password for web access to all past and future articles will then follow by a separate e-mail.
How Your Articles Are Delivered
Upon the processing of your credit card or the receipt of a personal check, Sand Spring will e-mail you the articles requested as a Word attachment, and also provide you with a WWW address and password to view the article on the web without using Word should you so desire. Confirmation of your order will be immediate, and the actual article will follow by e-mail typically within a few hours and in all cases before the opening of NYSE trading on the following day.
Ordering by Credit Card:
Our shopping cart is designed for both physical and subscription products, so do not be confused too much when it asks you for a shipping address. A correct address is important only for credit card authorization purposes. Your e-mail information is the most important piece of information to us for proper delivery of your article(s).
Disclosure Statement
Sand Spring Advisors provides information and analysis from sources and using methods it believes reliable, but cannot accept responsibility for any trading losses that may be incurred as a result of our analysis. Individuals should consult with their broker and personal financial advisors before engaging in any trading activities, and should always trade at a position size level well within their financial condition. Principals of Sand Spring Advisors may carry positions in securities or futures discussed, but as a matter of policy will always so disclose this if it is the case, and will specifically not trade in any described security or futures for a period 5 business days prior to or subsequent to a commentary being released on a given security or futures.
If you order by credit card, your credit card will be billed as "Sand Spring Advisors LLC"
973-829-1962 or by email at the address below:


Take me back to the Sand Spring Home Page
Comments or Problems
Thank you for visiting Sand Spring Advisors LLC, Inc. We hope to hear from you again soon. For more information on Sand Spring Advisors actual programs, services, or to request a copy of a Disclosure Document, please phone us at 973 829 1962, FAX your request to 973 829 1962, or e-mail us at information@Sandspring.com


| Corporate Office: 10 Jenks Road, Morristown, NJ 07960 Phone: 973 829 1962 Facsimile: 973 829 1962 |
Best Experienced with
Click here to start.
The material located on this website is also the copyrighted work of Sand Spring Advisors LLC. No party may copy, distribute or prepare derivative works based on this material in any manner without the expressed permission of Sand Spring Advisors LLC
This page and all contents are Copyright © 2000 by Sand Spring Advisors, LLC, Morristown, NJ